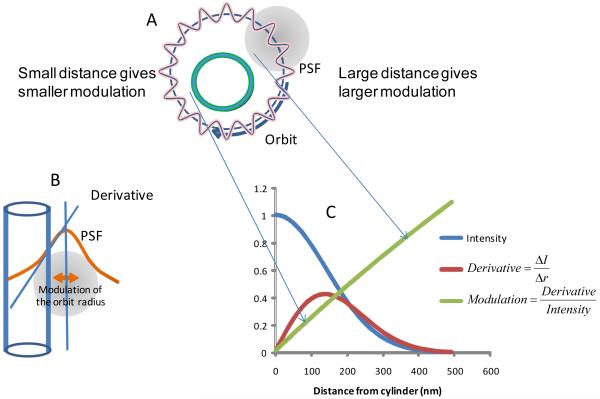
Figure 1.
Schematic of the modulation tracking technique. (A) The scanner is programmed to move the laser beam around the microvillus in a circular orbit with radius larger than the radius of the microvillus which is modeled as a cylinder in the figure. The radius of the orbit is modulated at high frequency as shown by the laser path A. (B) When the illumination spot approaches the microvillus surface, due to the modulation of the orbit radius, the fluorescence intensity increases as schematically shown in B. The small oscillation of the radius effectively computes the spatial derivative. (C) The blue curve represents the intensity profile of the spot (the PSF). The red curve represents the spatial derivative of the intensity profile. The green curve is the ratio of the red curve to the blue curve. This ratio is the modulation function which depends on the distance from the surface. The modulation function increases quasi linearly as a function of the distance from the surface. By providing a feedback to the average orbit radius we can maintain the modulation constant, for example at a value of 0.5. The modulation function gives the distance of the surface according to the green curve for every value of the modulation.

