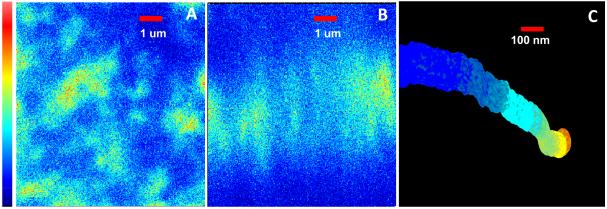
Figure 3.
Imaging microvilli. (A) x y raster scan image of OK cell expressing NaPi 2a Cerulean. The microvilli appear as the roundish bright areas in this projection. (B) Detail of the same cell imaged in the x z plane showing adjacent microvilli. The color scale at left for panel A and B corresponds to 0 to 255 levels of the analog output of the LSM 510 microscope. (C) 3D reconstruction of a microvillus using the MT technique. The region reconstructed is about 2 um long. The image is painted according to the fluorescence intensity. The color scale at right corresponds to 0 256KHz of the photon counting acquisition electronics of the M5 microscope. The brightest part is toward the base of the microvillus. Note the non uniform distribution of the fluorescence along the microvillus.

