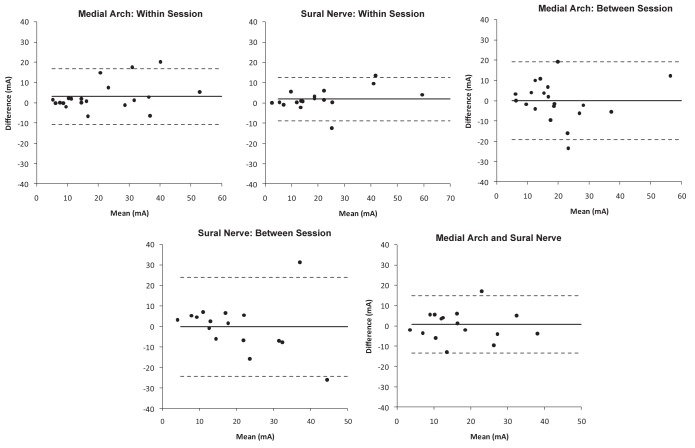
Figure 1).
Bland-Altman plots for nociception flexion reflex threshold obtained from medial arch and sural nerve stimulation. The upper plots show data from within the same session (measurement A, B), the middle plots show data from between sessions (measurement A, C), and the lower plot shows measurement A data from medial arch and sural nerve stimulation. The solid horizontal line indicates the bias and the dotted lines indicate the 95% limits of agreement

