Figure 4.
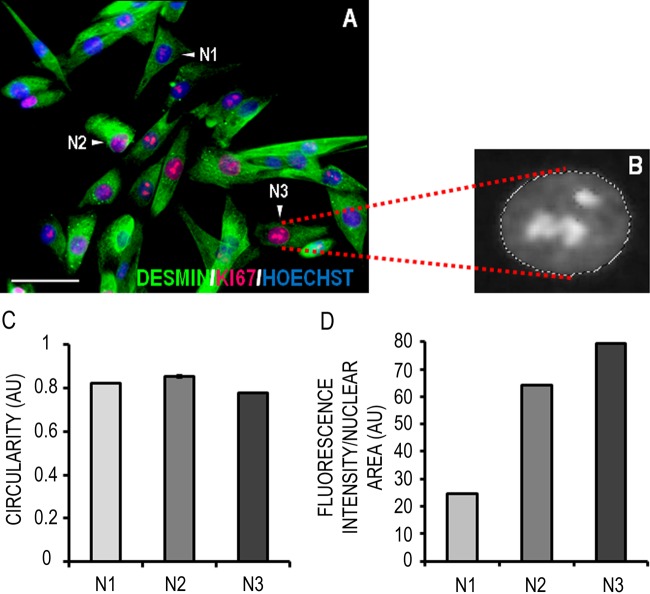
Quantification of Ki67 fluorescence intensity in the nucleus of proliferating muscle precursor cells (MPCs). (A) Representative micrograph of human MPCs under proliferation conditions expressing desmin (green) and Ki67 (red); DNA is labeled with Hoechst (blue). Scale bar = 50 μm. (B) Magnified gray scale image showing marching lines gating an individual nucleus in the Ki67 channel layer. (C) Once nuclei were selected based on Hoechst staining, an index of their circularity could be calculated. (D) The fluorescence intensity of Ki67 staining in three myoblast nuclei (N1, N2, and N3) was measured. Data are presented as mean ± standard deviation of three replicate measurements performed on the same cells (N1, N2, and N3). Note that although this analysis was performed on individual cells, it can also be applied to entire fields of view.

