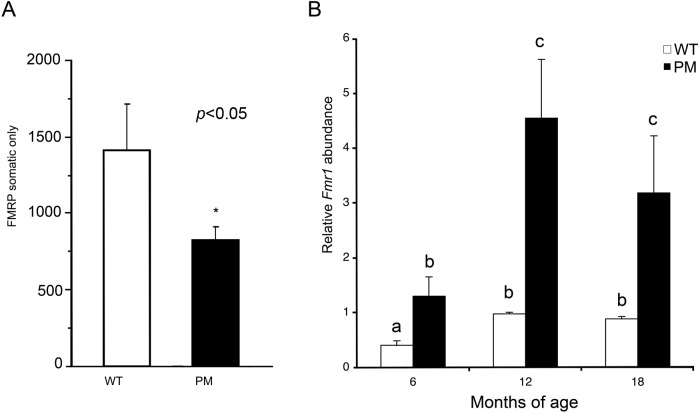
Figure 3.
Changes in FMRP and Fmr1 expression. (A) Intensity measures of FMRP in somatic cells of the ovaries of five- to seven-week-old mice. Wild-type (WT), black bar; premutation (PM), open bar (*p<0.05, analysis of variance [ANOVA]). (B) Total ovarian Fmr1 mRNA (mean ± SEM) normalized to glyceraldehyde-3-phosphate dehydrogenase (GAPDH) in WT (white bars) and PM mice (black bars) at 6, 12, and 18 months of age. Bars with different letters are significantly different by two-way ANOVA.

