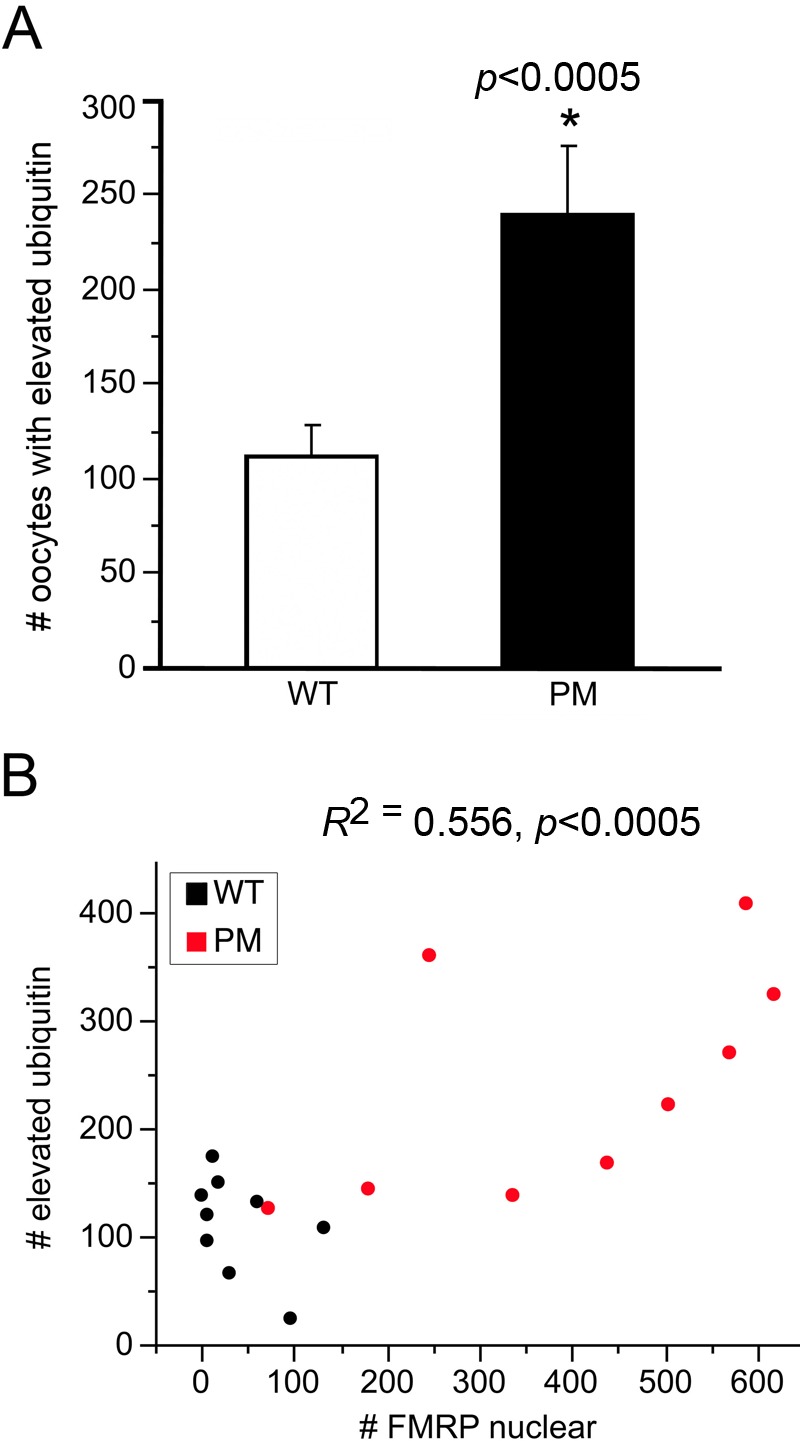
Figure 8.

(A) Numbers of follicles in wild-type (WT) and premutation (PM) mice that expressed elevated or abnormally distributed ubiquitin. Numbers of oocytes in WT (open bar) and PM (black bar) mice had either visibly increased ubiquitin throughout the cytoplasm or high nuclear or perinuclear concentrations of ubiquitin. *p<0.005. (B) Relationship between numbers of oocytes with nuclear concentrations of FMRP and oocytes with elevated ubiquitin immunoreactivity (WT, black dots; PM, red dots).
