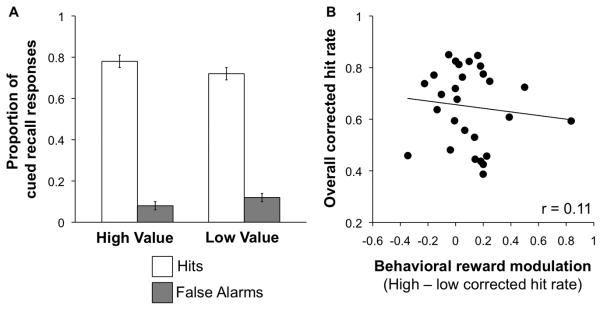
Figure 2.
Behavioral results. (A) Percentage of hits (white bars) and false alarms (gray bars) for high-value and low-value associations. Error bars represent standard error of the mean. (B) Cued recall performance (as measured by overall corrected hit rate) as a function of behavioral reward modulation (the difference in corrected hit rate for high and low-value associations). Overall corrected hit rate was not correlated with the degree of behavioral reward modulation (p > 0.5).

