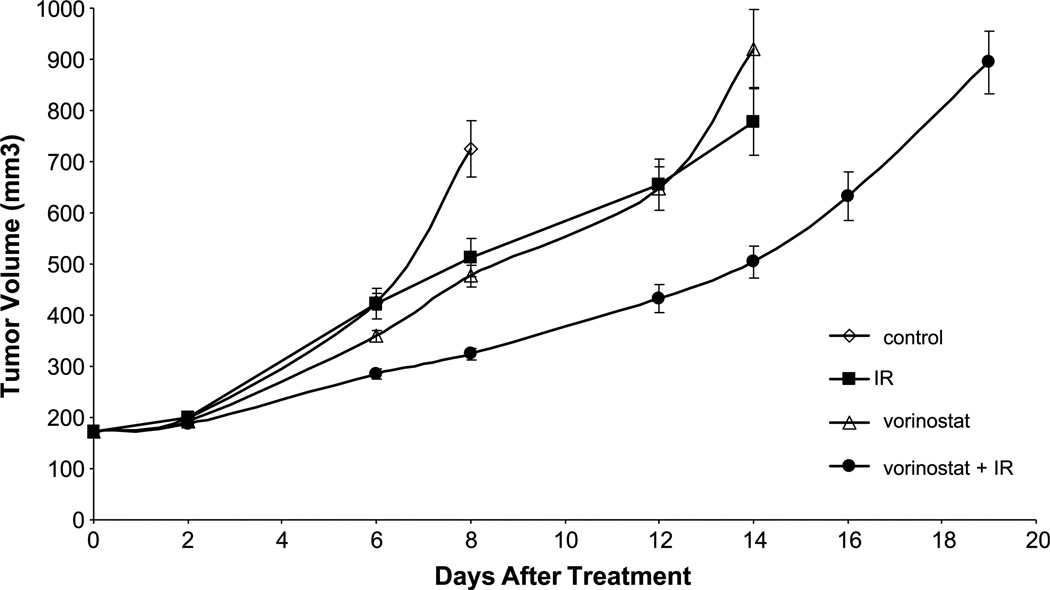
Figure 5.
The effects of vorinostat on radiation-induced MDA-MB-231-BR tumor growth delay. Points, mean tumor volume in mice after treatment with vorinostat, irradiation, or vorinostat ± irradiation; bars, SD. When tumors reached 172 mm3 in size, mice were randomized into four groups: vehicle, vorinostat (50 mg/kg), irradiation (3 Gy), or vorinostat plus irradiation (50 mg/kg, 3 Gy). A single dose of vorinostat was delivered as p.o. gavage at 6 h before 3 Gy to the tumor. To obtain a tumor growth curve, perpendicular diameter measurements of each tumor were measured every 2 d with digital calipers, and volumes were calculated using the following formula: L × W × W/2. Each group contained five mice except control group, which contained 10 mice.

