
Figure 9.
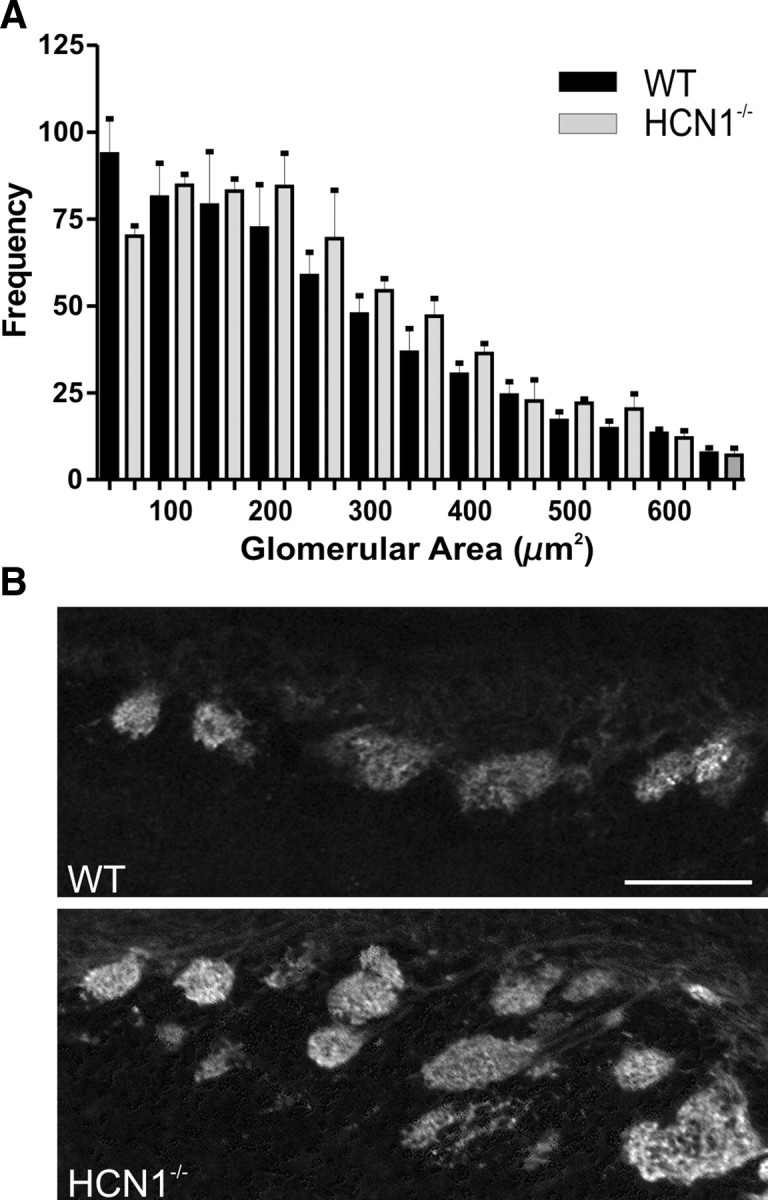
Glomerular size and distribution are perturbed in P4 HCN1−/− mice. A, Binned distribution shows the frequency of glomerular area (μm2) among dorsal glomeruli in WT and HCN1−/− mice. B, VGlut2-labeled sections from similar regions in WT and HCN1−/− mice; note the radial stacking of glomeruli in the HCN1−/− mice. Scale bar, 100 μm. Error bars, SEM.