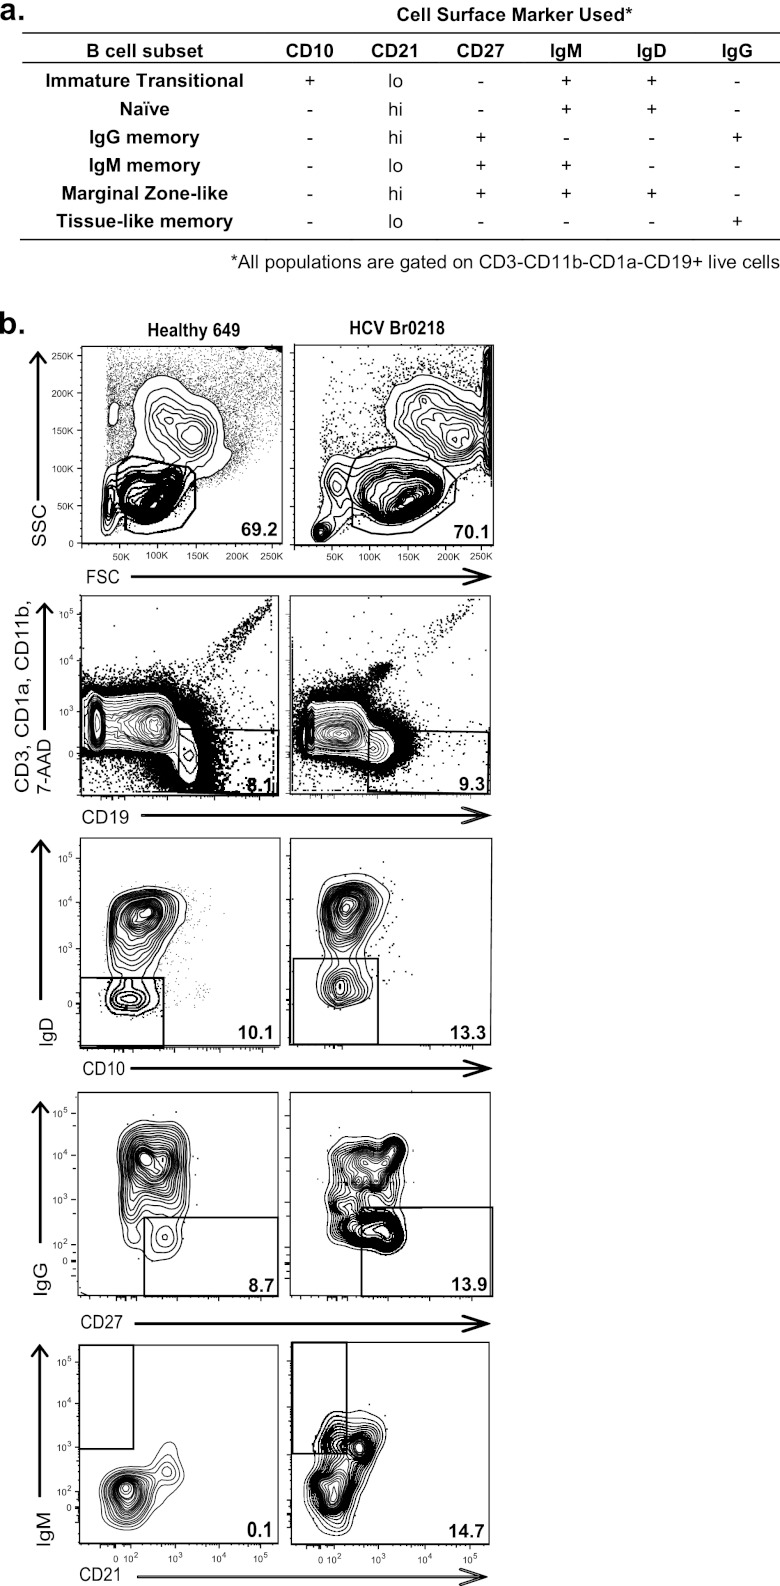
Fig 1.
Representative scheme of the flow cytometry analysis used in this study. (a) Cell surface markers used to distinguish PB B cell subsets. (b) Flow cytometry analysis of healthy donor 649 (left) and HCV donor Br0218 (right) cells to quantify the percentage of IgM memory B cells in the total live B cells. Numbers are percentages of the indicated gates. Live lymphocytes (FSC versus SSC) per total PBMCs are gated. Total B cells (CD19+ CD3− CD1a− CD11b−) are gated per total live lymphocytes. To further distinguish the IgM memory B cell subset, subsequent gating was applied using the presence or absence of additional cell surface markers as shown.

