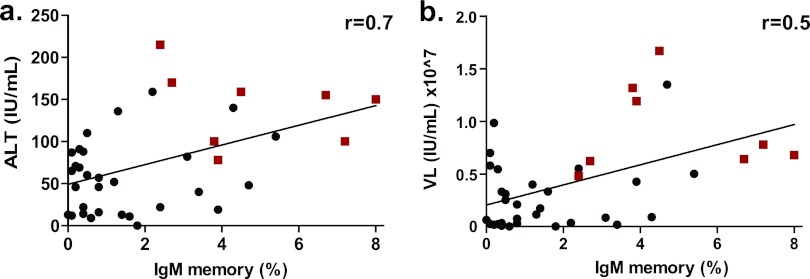
Fig 6.
Correlation analysis of liver damage. IgM memory B cell expansion (%) versus the ALT level (a) and viral load (b) (in-house quantification) are indicated for the HCV-infected cohort (n = 38). Red squares and black circles represent individuals whose plasma tested positive and negative for ANA reactivity, respectively. The correlation coefficient (r) was calculated using Spearman's method.

