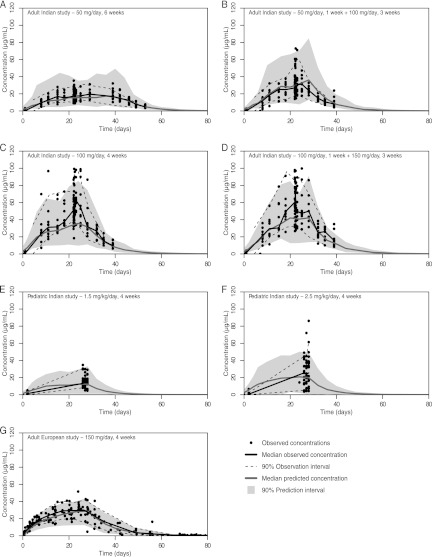
Fig 1.
Visual predictive checks for the population pharmacokinetic model employing allometric scaling based on fat-free mass. The dots represent the observed concentrations, the black line indicates the median observed concentration, and the dotted lines show the 5th and 95th percentiles of the observations (indicating the 90% observation interval). The dark gray line indicates the median predicted concentration from 1,000 simulated individuals, and the gray area shows the 90% prediction interval of the model predicted values. The plots are stratified for each different dosing regimen that was used in the respective clinical trials (Adult Indian study, 4 regimens, plots A to D; Pediatric Indian study, 2 regimens, plots E and F; Adult European study, 1 regimen, plot G).

