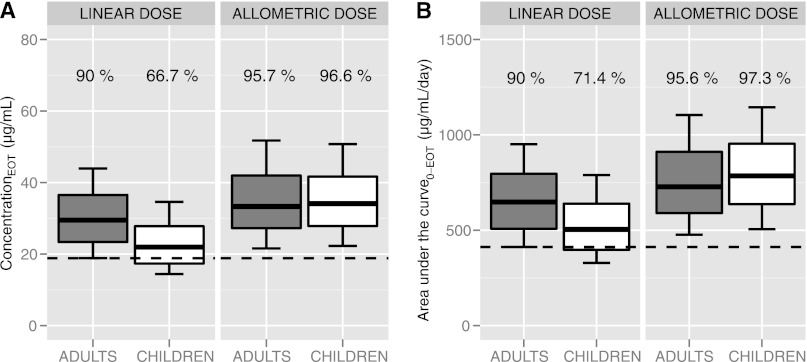
Fig 3.
Comparison of miltefosine exposure levels in children and adults: predicted concentration at the end of treatment and the area under the plasma concentration-time curve. These box plots represent distributions of the central miltefosine exposure following from Monte Carlo simulations of 1,000 adults (in gray) and 1,000 children (in white) receiving either the linear miltefosine dose (2.5 mg/kg/day) or the allometric daily miltefosine dose proposed here (Table 4 and equation 6). (A) Concentration at the end of treatment (CEOT). (B) Area under the concentration-time curve from start to end of treatment (AUC0-EOT). The pharmacokinetic target to be attained was the minimal adult exposure, set at the value that was attained by 90% of the adults receiving the linear dose (indicated by the dashed line); the percentages above the box plots show the proportions of individuals reaching this target.

