
Fig 3.
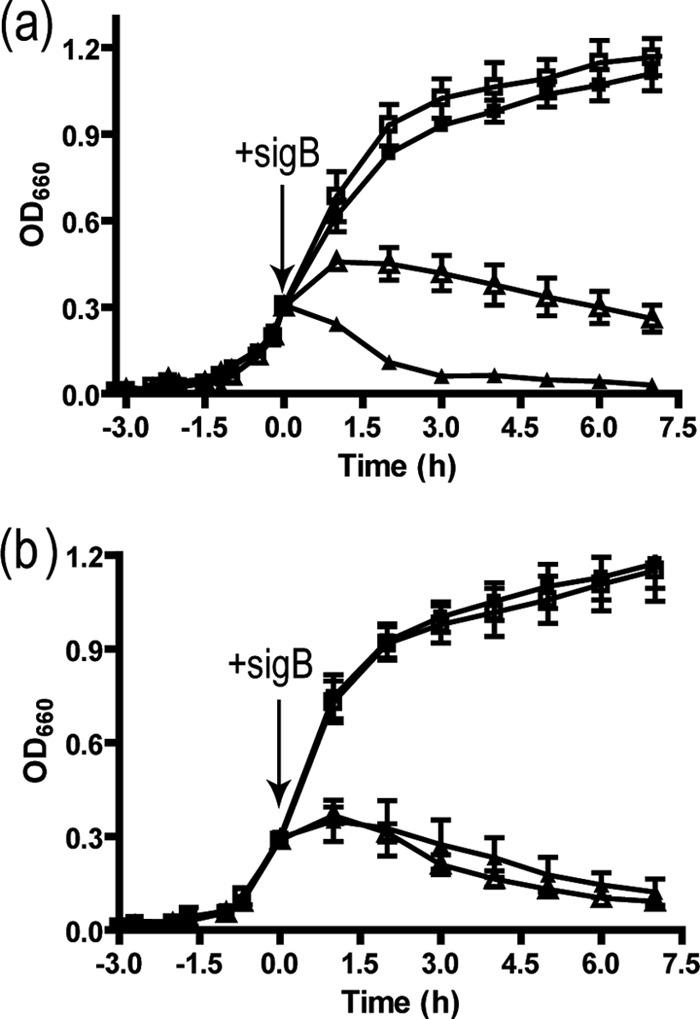
Effect of signermycin B on cell growth after induction of WalK or WalR. (a) B. subtilis 168 was transformed with pHT10 (■, ▲) and pBsG-full (□, △) and cultured in Luria broth containing 1 mM IPTG at 37°C until the OD660 reached 0.3. Cultures were incubated in the presence (▲, △) or absence (■, □) of signermycin B (final concentration, 3.13 μg/ml), and the OD660 was determined at the indicated times. The arrow shows the time at which signermycin B was added to the culture. Error bars represent standard errors of the means from three independent assays. (b) B. subtilis 168 was transformed with pAN18 (■, ▲) and pABF (□, △) and cultured until the OD660 reached 0.3. Cultures were incubated in the presence (▲, △) or absence (■, □) of signermycin B (final concentration, 3.13 μg/ml) to measure OD660 at the indicated times.