
Fig 5.
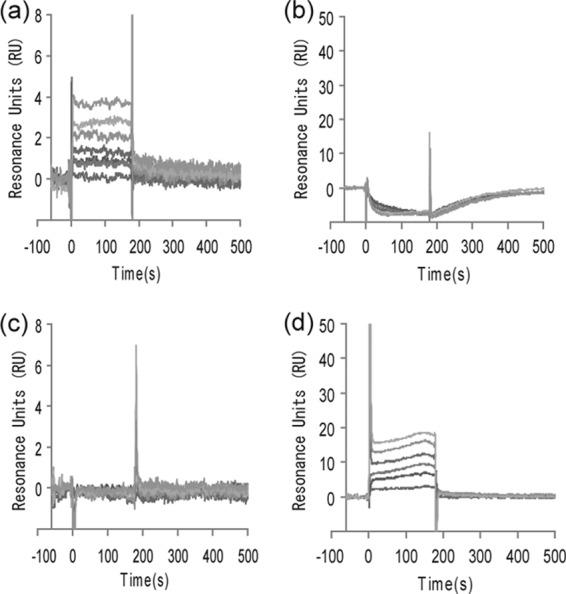
Surface plasmon resonance sensorgrams. The dimerization domain (a and c) and ATP-binding domain (b and d) of B. subtilis WalK (Fig. 3) were immobilized on a sensor chip. Signermycin B (a and b) and ATP (c and d) were used as analytes. Normalized response units (RUs) were plotted against time (s). Sensorgrams with the following analyte concentrations were plotted in order of increasing normalized RUs: signermycin B, 0, 33.4, 50.2, 75.3, 113, 170, 256, and 385 μM; ATP, 15.6, 31.25, 62.5, 125, 250, and 500 μM.