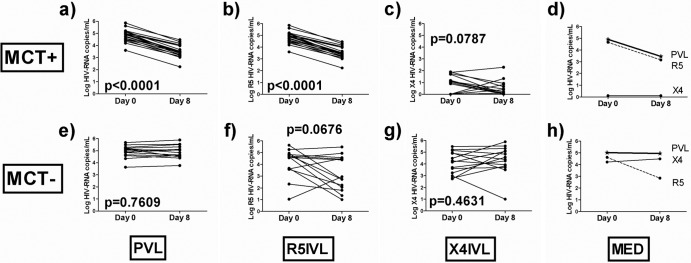
Fig 1.
Viral load evolution during the MCT. (a to d) MCT+ patients; (e to h) MCT− patients. (a and e) Plasma viral load (PVL) evolution; (b and f) R5-tropic inferred viral load (R5IVL) evolution; (c and g) X4-tropic inferred viral load (X4IVL) evolution; (d and h) median viral load evolution (MED). The dashed lines represent the R5IVL, the solid lines represent the X4IVL, and the thick lines represent the PVL, which coincides with the R5IVL in panel d.

