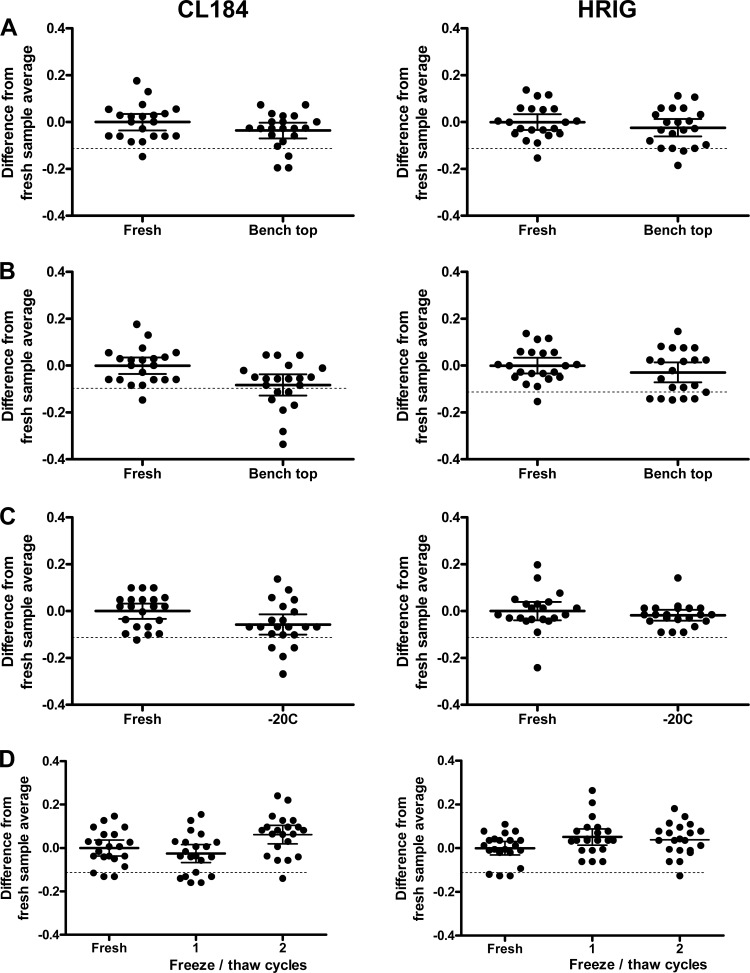
Fig 3.
Stability experiments. (A) Bench top stability of quality control (QC) samples. (B) Bench top stability of virus stock. (C) Stability at −20°C. (D) Freeze-thaw stability. Fresh aliquots of QC samples 4, 6, and 8 are compared with stability samples that underwent specific stability conditions. International units (IU) titers were log transformed and normalized for the difference between the measurement and the average of the fresh sample titer. Solid lines represent the mean; dotted lines represent the indifference limit of 0.114 log IU/ml.

