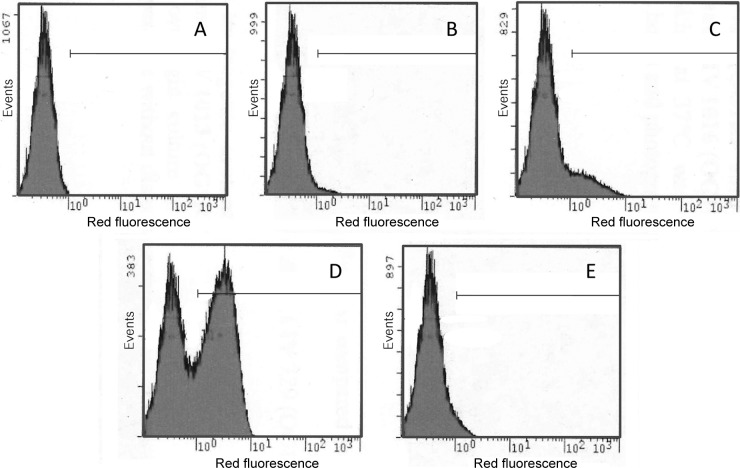
Fig 4.
Analysis of viability in cell populations using fluorescence-activated cell sorting (FACS) analysis. Cells were labeled using the Live/Dead viability assay kit (Invitrogen), and 100,000 events were recorded. OG1RF (A), TX5264 (OG1RF gelE) (B), Liv729 (OG1RF salB) (C), Liv1016 (OG1RF salB gelE) (D), and Liv883 (OG1RF salB pAT18::salB) (E) were harvested at exponential (5 h) growth phase. Horizontal lines mark populations of dead cells.

