Fig 2.
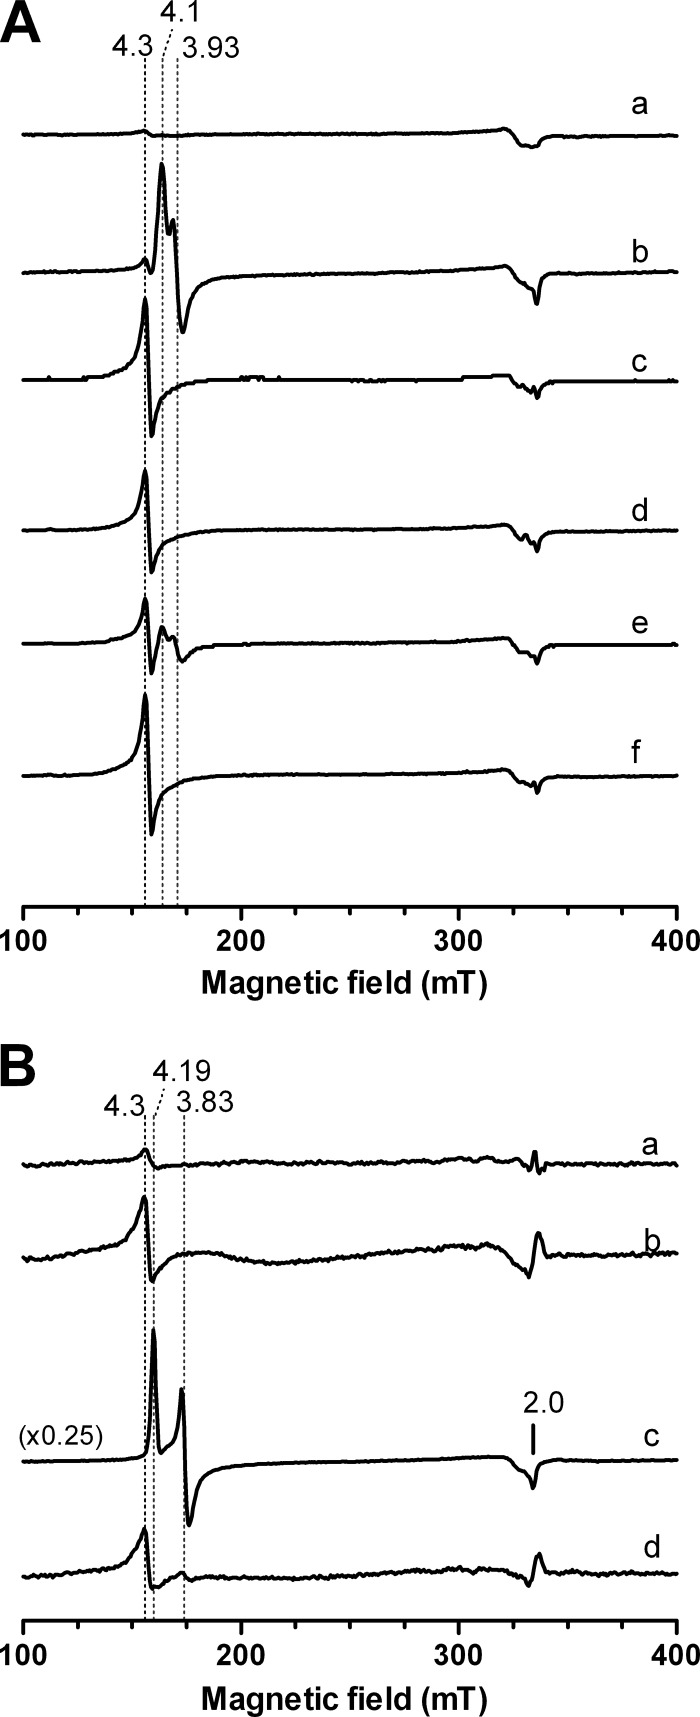
EPR analysis of the influence of H2O2 on the binding of NO to the mononuclear iron center of NorR. (A) Whole-cell EPR analysis of E. coli overexpressing NorR. EPR spectra of E. coli BL21Gold(DE3) carrying pT7.7-NorR were recorded in the absence of stress (a), after 5 min of treatment with 150 μM NO (b) or 4 mM H2O2 (c), after sequential treatment with 150 μM NO (5 min) followed by 4 mM H2O2 (5 min) (d) or with 4 mM H2O2 (5 min) followed by 150 μM NO (5 min) (e), and after a simultaneous 5 min of treatment with 150 μM NO and 4 mM H2O2 (f). (B) EPR spectra of the purified NorR protein (75 μM), as isolated (a) or treated for 5 min with 150 μM H2O2 (b), 150 μM NO (c), or NO plus H2O2 (150 μM each) (d). With the exception of spectrum c in panel B, all spectra have the same intensity scale. EPR spectra were recorded at a 9.39-MHz microwave frequency, 2.4-mW microwave power, and 6 to 7 K.

