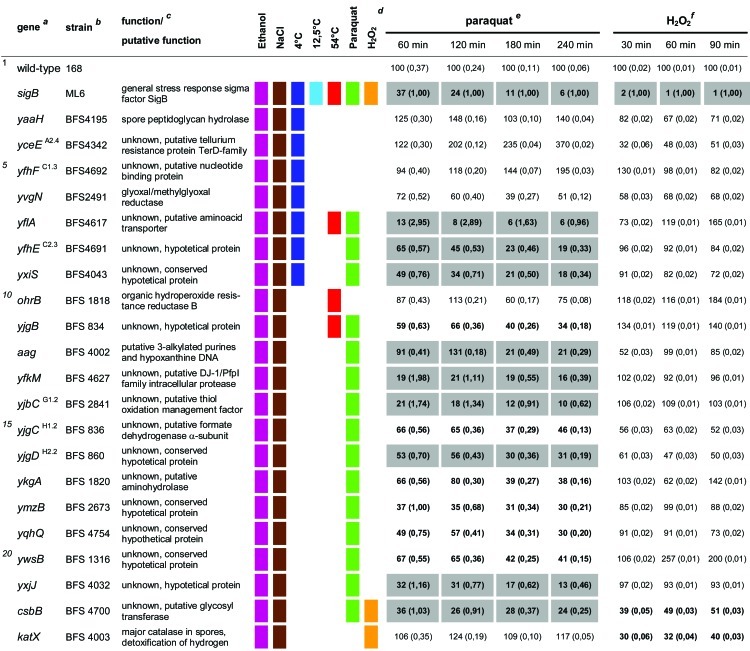
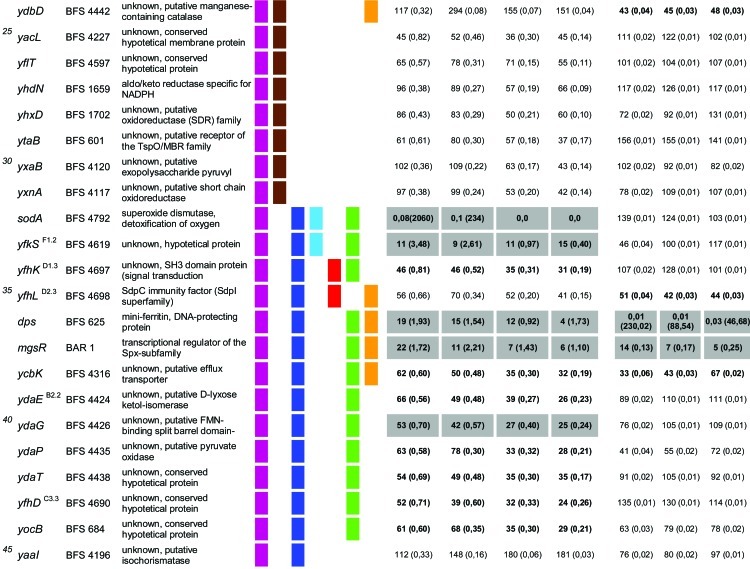
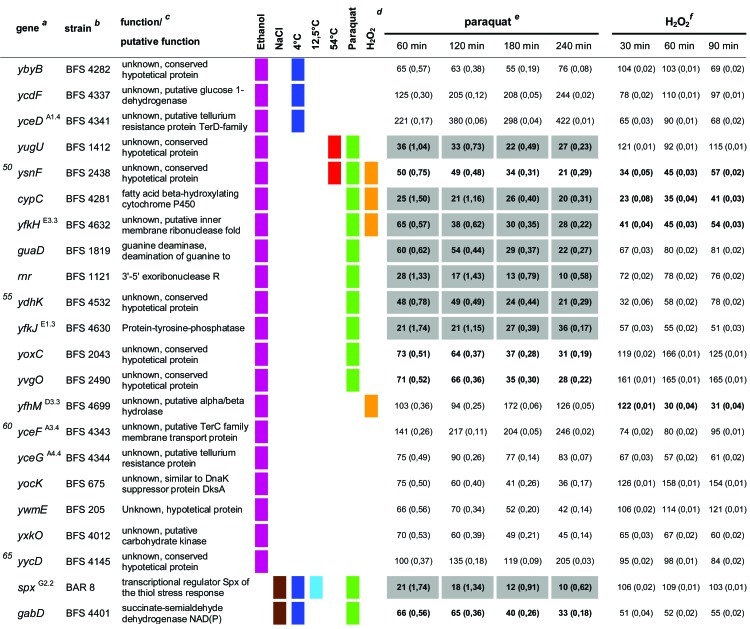
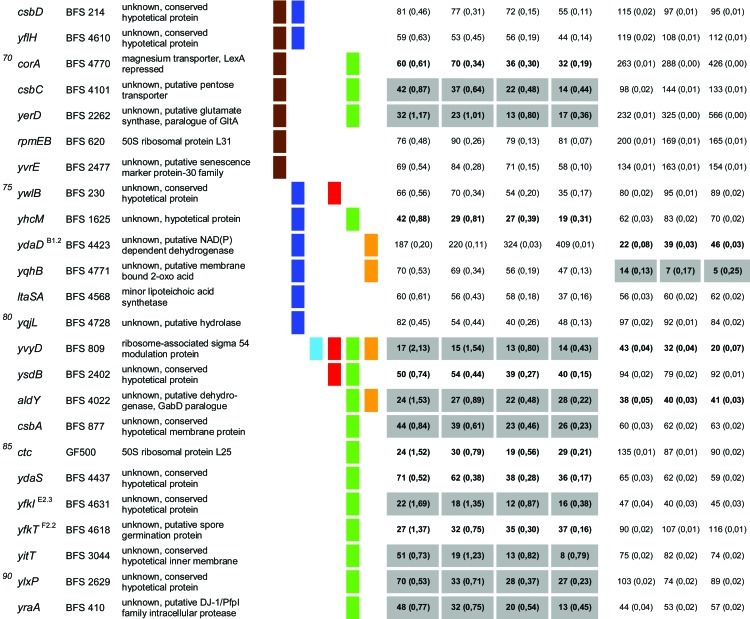
Table 1.
Quantitative evaluation of the survival rates of B. subtilis wild-type strain 168, the sigB mutant (ML6), and 94 individual general stress gene mutants in response to paraquat and H2O2 stressesa,b,c,d,e,f
The genes are ordered by sensitivity clusters according to reference 21. The genes of each cluster are in alphabetical order. The operon affiliation of the respective genes is indicated at the top right. The code A1.4, for example, means that this gene is the first of four genes of operon A.
Mutant strains of the respective genes used in this study.
Known or putative function of the respective gene products.
Summary of all sensitive phenotypes determined previously by Höper et al. (21) and in this study. The list was sorted according to clusters of sensitive phenotypes in the following order: ethanol (pink), NaCl (brown), 4°C (light blue), 12.5°C (dark blue), 54°C (red), paraquat (green), and H2O2 (orange).
Survival rates of the mutants in response to 100 mM paraquat are expressed relative to those of the wild type and sigB mutant strain ML6 for each time point tested. The wild-type values were defined as 100% for direct comparison with the mutant strains; thus, the survival rates of the mutants reflect percent survival rates based on the wild-type level. The comparison with the sigB mutant (values in parentheses) represents the fold difference compared to the single mutant strains. Thus, values lower than 1 indicate that the mutant strain was less sensitive than the sigB mutant, and values higher than 1 indicate that the mutant was more sensitive than the sigB mutant. The values for direct comparisons of the wild type and the sigB mutant are given in the first and second rows. Boldface type indicates significant differences with a confidence level of an α value of ≤0.01. Values that passed an even more stringent confidence level of an α value of ≤0.001 are shaded in light gray.
Survival rates of the mutants in response to 5 mM H2O2 are expressed relative to those of the wild type and sigB mutant strain ML6 for each time point tested (see above).


