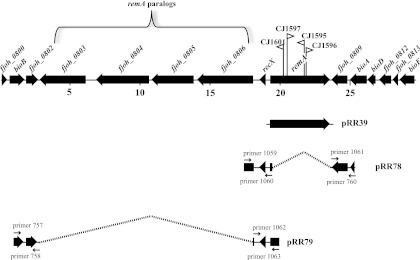
Fig 1.
Map of the remA region. Numbers below the map refer to kilobase pairs of sequence. The sites of HimarEm1 insertions in remA are indicated by triangles, with orientations indicated by the direction in which the triangle is pointing. Triangles pointing to the right in this diagram (CJ1597 for example) have IR2 on the right side and the kanamycin resistance gene of the transposon reading toward the right. The regions of DNA carried by plasmids used in the present study are indicated beneath the map.

