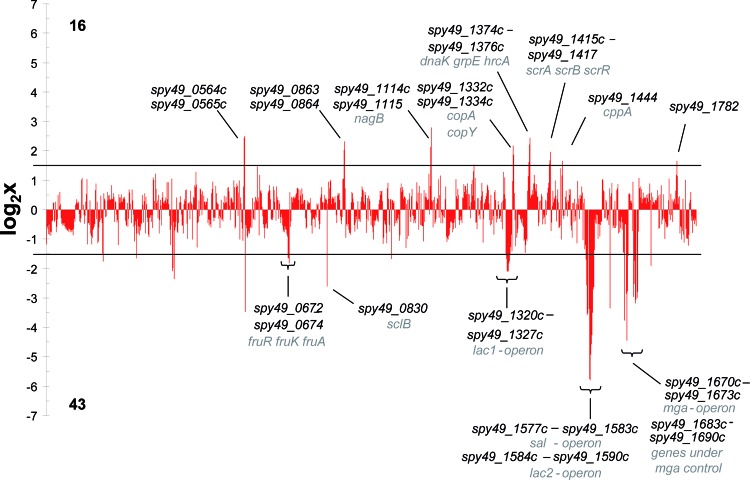
Fig 4.
Overview of the transcript levels in the Δralp3 mutant in the transition phase. Log2 expression ratios of the mutant are shown. All genes with log values >1.58 are significantly induced, and genes with a negative log of <−1.58 are significantly reduced. All genes between the lines are considered as not significantly influenced.

