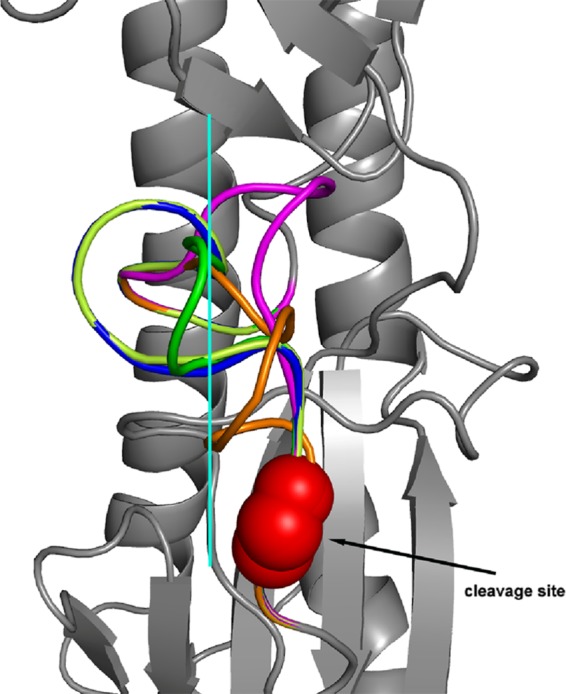
Fig 4.

Structural analysis of amino acid mutations at the P6 position of the HA cleavage site. Shown is a side view of the H3 HA trimeric structure based on A/Aichi/2/1968 (Protein Data Bank [PDB] accession number 1ha0) showing the different conformations of the cleavage site loops containing various amino acids at the P6 position (green, G; lemon, I; magenta, deletion; blue, R; orange, S). Red spheres represent the cleavage site, and the solid cyan line separates mutations into two groups based on the conformation.
