Fig 1.
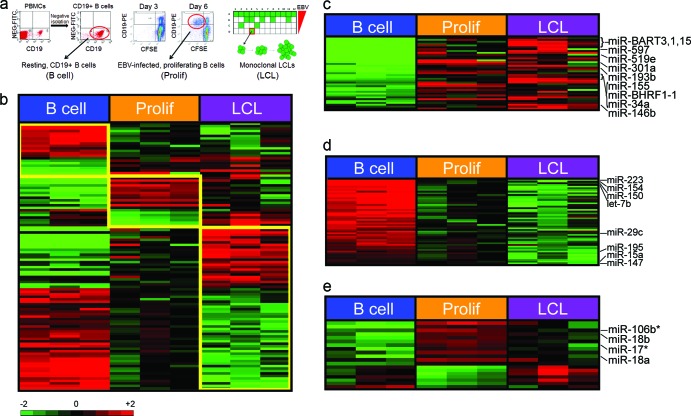
EBV regulates cellular miRNA expression. (a) Schematic of samples used for miRNA microarray analysis. (Left) CD19+ B cells were purified by negative selection from peripheral blood mononuclear cells (North Carolina Red Cross). The dot plots show CD19-phycoerythrin (PE) staining on the x axis and nonspecific fluorescein isothiocyanate (FITC) channel on the y axis from PBMCs or negatively isolated cells. Purity was consistently >95% CD19+ cells. (Middle) Dot plots of CD19-PE (y axis) versus CFSE (x axis) indicate B cells proliferating after EBV infection. At 3 days postinfection, few cells are dividing (i.e., CD19+/CFSElow), while by 6 days postinfection, proliferating B cells are readily visible. The red circle indicates the population of cells that was sorted for each donor. (Right) Schematic diagram of a plate in which EBV infection of PBMCs leads to monoclonal LCL outgrowth. The amount of virus plated was diluted from top to bottom through a plate, and outgrowth, indicated by the green wells, was monitored at 3 to 4 weeks. Cells growing out at the lowest virus dilutions were grown until cell lines were established (red box). LCLs were derived in this manner for each of the three healthy donors analyzed for miRNA expression. (b) Expression profiles of resting CD19+ B cells; EBV-infected early-proliferating, i.e., CD19+/CFSElow, cells (Prolif); and monoclonal LCLs. Differentially expressed miRNAs that define each group are depicted over 4-fold levels in a color scale. (c) miRNAs that are upregulated by EBV are shown in a color scale. (d) MiRNAs that are downregulated by EBV infection are shown in a color scale. (e) MiRNAs selectively upregulated or downregulated in early-proliferating EBV-infected cells are shown in a color scale. The asterisks indicate miRNA-star strands (putative unincorporated miRNA strands) detected on the array.

