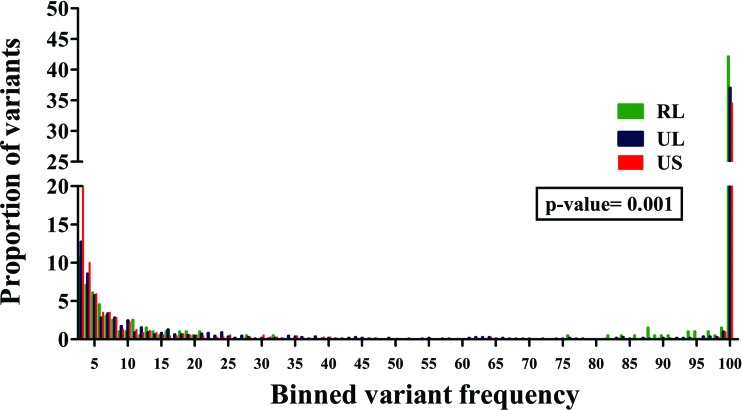
Fig 6.
A significant difference was found in the frequency distribution of variants across the different regions of viral genomic sequences within a GBM specimen. A frequency distribution of all of the variants found within the 58T GBM specimen across the RL (green), UL (blue), and US (red) regions. Kruskal-Wallis testing revealed a significant difference among the distributions, with a P value of 0.001.

