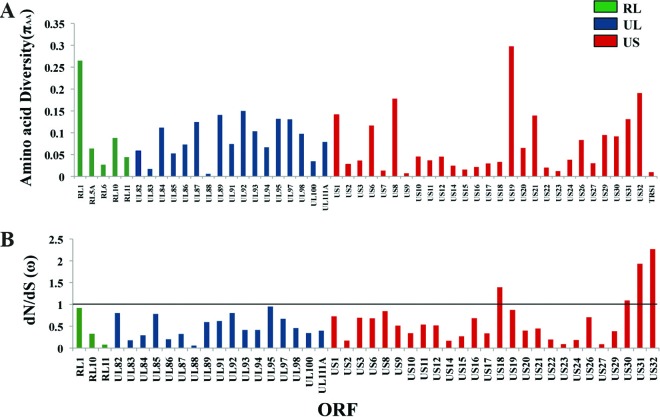
Fig 7.
Deep sequencing revealed amino acid variability across the viral ORFs within the 58T GBM specimen. (A) Plot showing amino acid diversity (πAA) across different ORFs. (B) Plot of variable dN/dS (ω) values across different ORFs. The RL region is indicated in green, the UL region is indicated in blue, and the US region is indicated in red. The straight line denotes a cutoff of ω = 1 under an assumption of neutrality. ORFs containing only nonsynonymous changes were not included in the dN/dS analysis.

