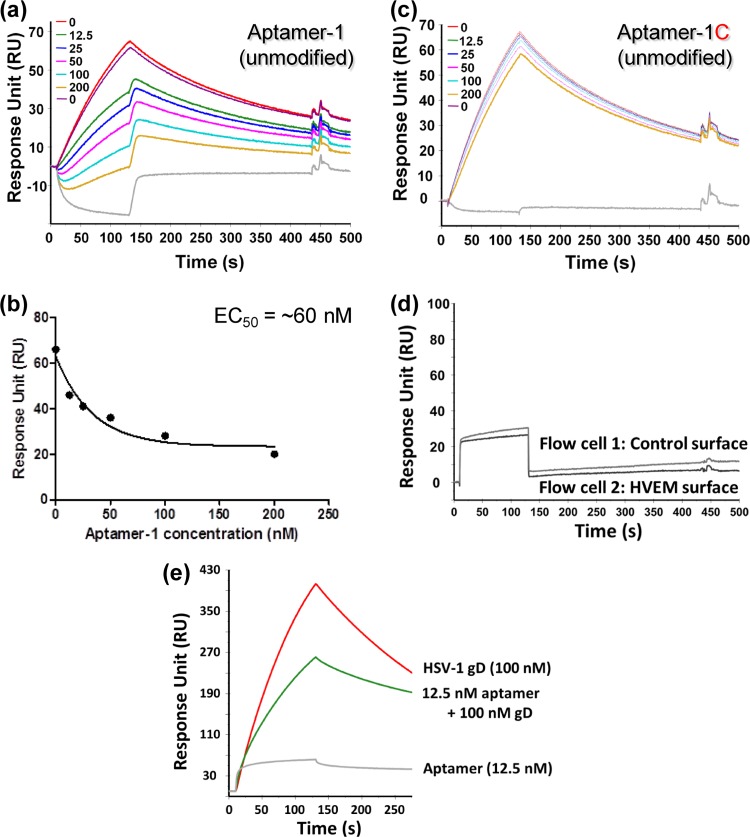
Fig 6.
Ability of aptamer-1 to interfere with gD-HVEM and gD–nectin-1 interactions. (a) gD-HVEM interaction responses observed in the absence of aptamer-1 or with increasing concentrations of aptamer-1 (unmodified) ranging from 12.5 to 200 nM. The gray line represents the injection of 200 nM aptamer alone. (b) The observed responses for each concentration of aptamer-1 were plotted, and the EC50 was estimated. (c) gD-HVEM interaction responses observed with increasing concentrations of aptamer-1C (unmodified). (d) Representative raw sensorgrams observed upon aptamer injection over flow cell 1 (control surface, CM5 chip) and flow cell 2 (HVEM surface). (e) gD–nectin-1 interaction responses observed in the absence and in the presence of aptamer-1.

