
Fig. 2. Large-scale functional connectivity discriminates between processing of masked fearful and neutral faces.
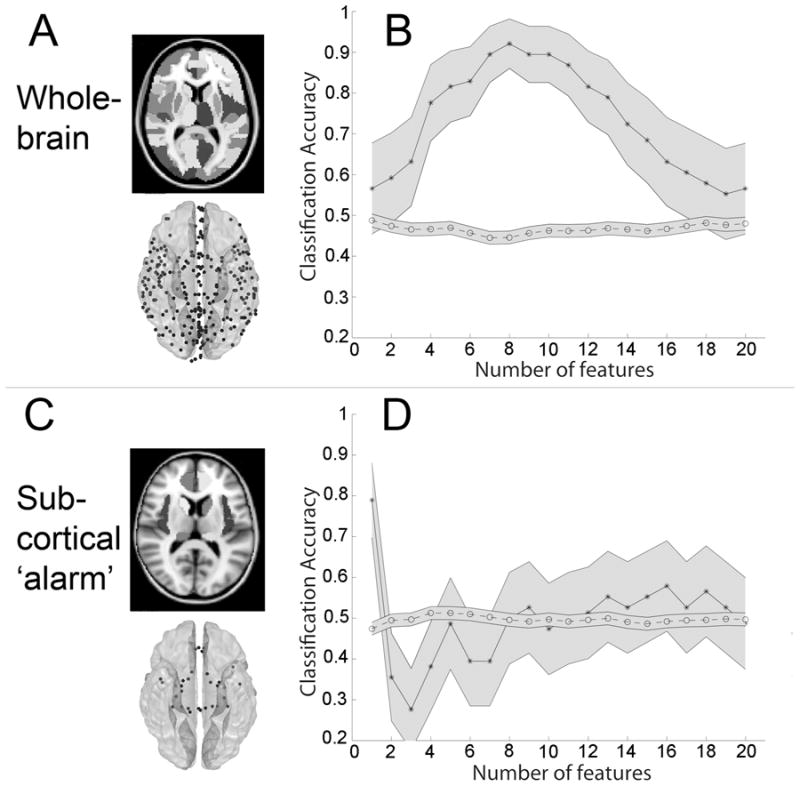
(A) Slice depicting anatomic parcellation scheme and average node locations (see also methods and Supplementary Figure 2A–B). (B) Decoding accuracy when classifying MF vs. MN as a function of the number of features (1 to 20) ranked in descending order by their absolute t-score. Maximum accuracy for MF vs. MN classification (92%, p < 0.0001) was achieved when learning was based on the top 8 features in each training set. (C) Discriminating subliminal fear using large-scale connectivity among “subcortical alarm” and other limbic regions. Bilateral masks for hippocampus, dorsal and ventral amygdala, insula and caudate, anterior cingulate, pulvinar and superior colliculus were defined using WFU_pickatlas with the exception of superior colliculus and locus ceruleus, which were manually drawn using FLSview (amygdala was manually separated into dorsal and ventral regions along z=0). These regions produced 32 nodes (depicted in D, bottom) and 496 total features. More slices of these regions and average MNI locations for each node are listed in Supplemental Figure 2C and Supplementary Table 2 respectively. (D) Classifications using pairwise correlations among the above regions as features and were performed similarly to those presented in Figure 2B. MF vs. MN classification reached a peak accuracy of 79% (p < 0.0001) at 1 feature. Mean accuracy scores for randomly permuted data are plotted along the bottom, and shaded grey regions represent 95% CI. (Because we permuted labels 50 times for each top N features, the total sample size for each null distribution was 50 times greater than for the real distribution, and hence CI are smaller.)