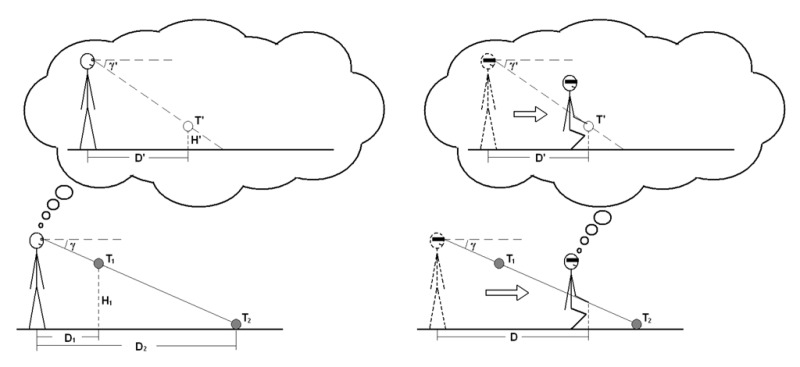
Figure 11.
Diagrams of explanation of the nearly accurate indication of the perceived gaze declination in the blind-walking and gesturing tasks. The lower plots are the physical situations while the upper plots (inside the bubbles) are the perceived situations according to the angular expansion hypothesis.

