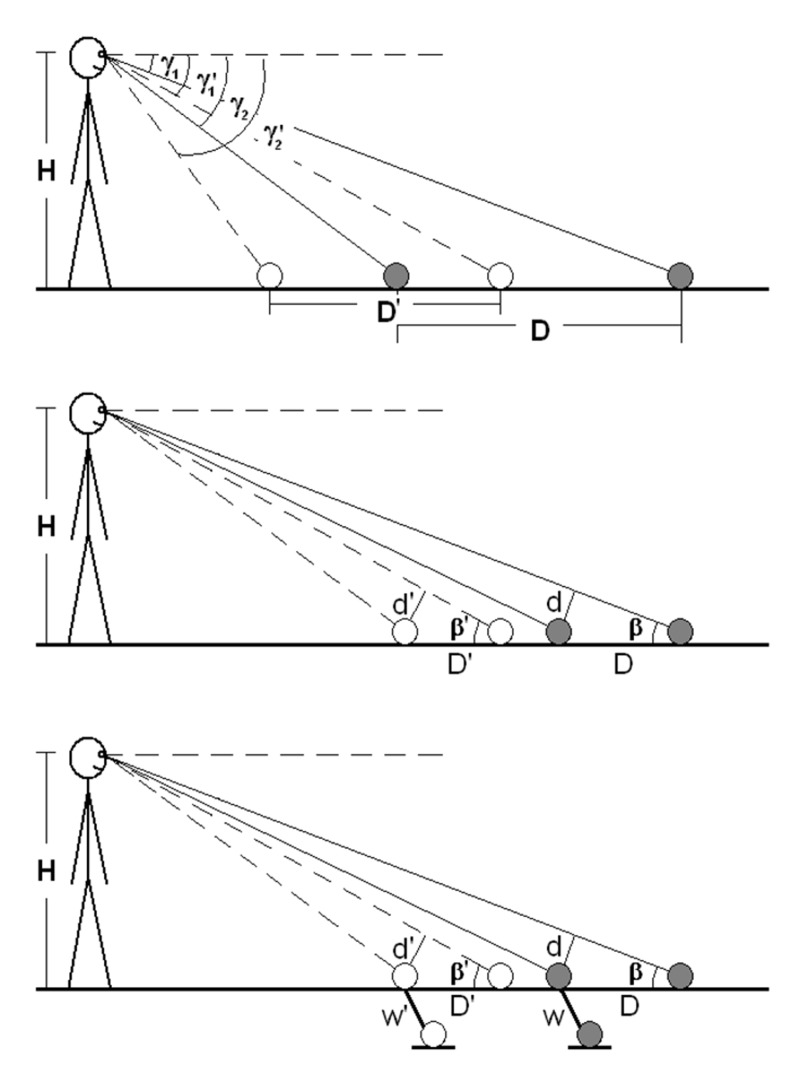
Figure 8.
Diagrams depicting the exocentric sagittal distance foreshortening based on the angular expansion hypothesis. Top, the gaze model. Middle, the optical slant model with isolated exocentric extent. Bottom, the optical slant model of the aspect ratio task. The gray circles represent the physical targets. The white circles represent the perceived targets.

