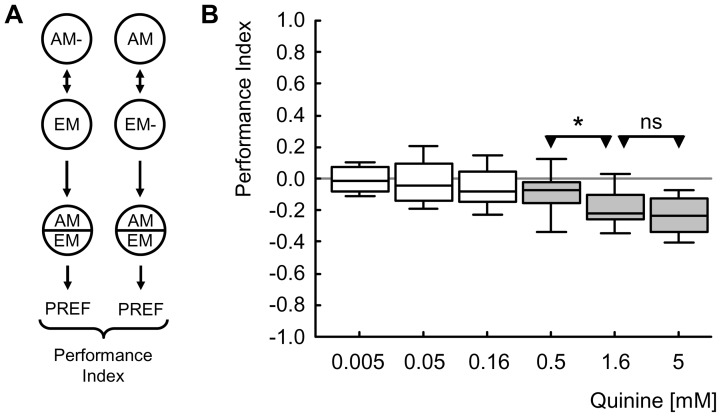
Figure 4. Reinforcement.
(A) Larvae are trained such that one group of larvae receives n-amylacetate while crawling on a QUI-containing Petri dish, whereas an empty odour container is presented in the absence of the reinforcer (i.e., AM-/EM training; left). Another group is trained reciprocally, i.e. with unpaired presentations of AM and reinforcement (AM/EM-; right) (note that for half of the cases the sequence of trials is as indicated; for the other half, sequences are reversed: EM/AM- and EM-/AM, respectively). After three such training cycles, larvae from both groups are tested on a QUI-containing Petri dish for their preference between AM and EM in a choice situation (for a documentation of these preference scores, see Figure S1). Associative learning is revealed by lower preference scores for AM in the group trained AM-/EM than in the reciprocally trained AM/EM- group. This difference is quantified by the displayed Performance Index (PI), such that negative PI values indicate conditioned avoidance. (B) The strength of QUI reinforcement depends on its concentration. In the range of concentrations tested (from 0.005 mM to 5 mM) the three highest concentrations support learning, but the three lowest concentrations do not. We find that QUI reinforcement reaches asymptote between 0.5 mM and 1.61 mM. The shading of the boxes indicates significant differences from zero, i.e. from chance behaviour (P<0.05/6 in one-sample sign tests, keeping the experiment-wide error rate at 5% [i.e. Bonferroni correction]); labelling of * or ns refer to P<0.05/2 or P>0.05/2 in Mann-Whitney U-tests. Box plots represent the median as the middle line and 25%/75% and 10%/90% as box boundaries and whiskers, respectively. Sample sizes are from left to right N = 13, 46, 29, 49, 29, 76).

