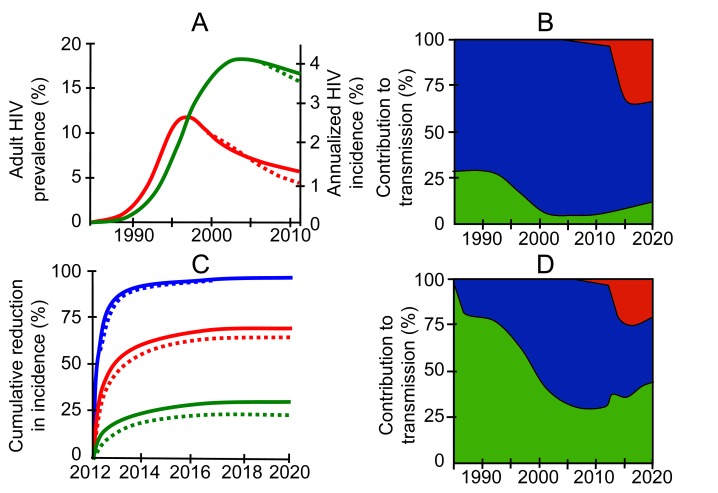
Figure 1. The predicted effect of different levels of acute infection on a combination prevention package including universal testing and treatment, as will be tested in the PopART trial [20].
(A) Green line: prevalence; red line: incidence. Two versions of a model are fitted to the adult HIV prevalence curve for South Africa (Joint United Nations Programme on HIV/AIDS): one “corrected” for serial monogamy effects in low-risk individuals [5], and thus with a low contribution of AHI (solid line), and one without the correction, and thus with a high contribution of AHI (dashed line). Fitted parameters are as follows: the proportion of individuals in three risk groups (low, medium, and high), rate of partner change for high-risk individuals, assortativity of mixing by risk, start time, early treatment rates, and an overall infectiousness parameter. Other parameters were fixed from the literature [13],[14]. (C) The intervention is introduced in 2012, and predictions are made until 2020, for three scenarios ranging from the very pessimistic (green line), through “just on target” (red line), to very optimistic (blue line). The results are surprisingly independent of the amount of transmission from AHI, as indicated by the solid versus dashed lines. (B and D) The contribution to transmission from individuals in different disease stages in the just-on-target scenarios is plotted in (B), corresponding to solid lines in (A) and (C) (corrected for serial monogamy effects), and (D), corresponding to dashed lines in (A) and (C) (not corrected for serial monogamy effects). Shown are all new infections of index cases in AHI and EHI (green), of index cases in untreated CHI (blue), and of index cases in treated CHI (red), as a proportion of total new infections.

