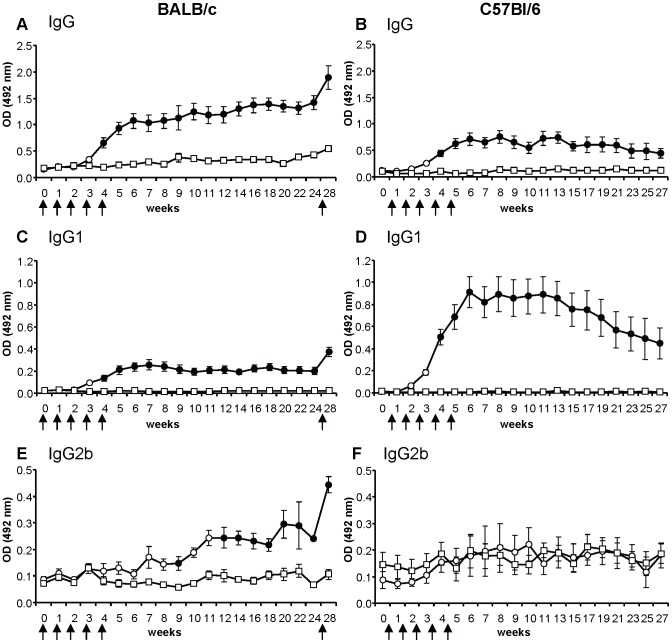
Figure 1. Anti-sand fly saliva antibody response in BALB/c and C57BL/6 mice bitten by Phlebotomus papatasi.
BALB/c mice (A, C, E) and C57BL/6 mice (B, D, F) were divided into control (squares) and experimentally bitten groups (circles). Mice in the latter group were exposed to sand fly bites (arrows) in weeks 1–5 and additionally in the week 27 (only BALB/c mice). Levels of specific IgG (A, B); IgG1 (C, D); and IgG2b (E, F) were measured by ELISA at all sampling points. Full circles represent significant difference between control and bitten mice (p<0.05). Data are presented as the means ± standard errors of the means. Two independent studies were done. OD = optical density.

