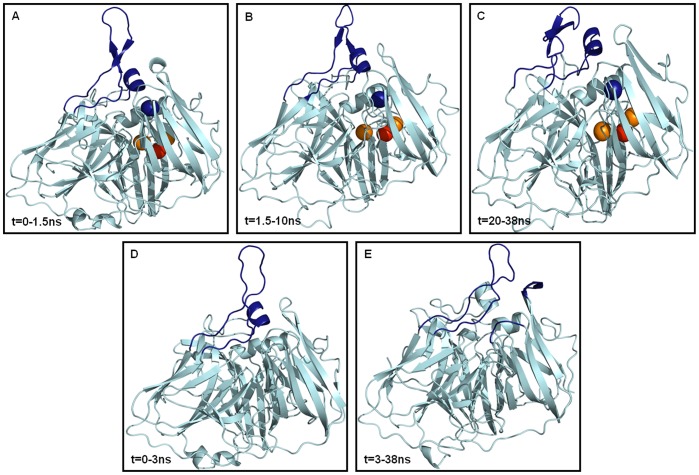
Figure 3. Structural evidences of the average conformations accessible in the 38 ns MD simulation for the holo-Tth-MCO (snapshots A–C) and apo-Tth-MCO forms (snapshots D–E).
The different secondary structure elements are represented in light blue cartoons. The protein regions involved in the open-closure of the electron-transfer site are in deep blue cartoons: Loop (β21–β24)D2 and α4-helixD2 for snapshots A-B and D, loop (β21–β24)D2 and (187-α4-201)D2 for snapshot C, loop (β21–β24)D2, loop (β25–β26)D3 and loop (β28–β29)D3 for snapshot E.

