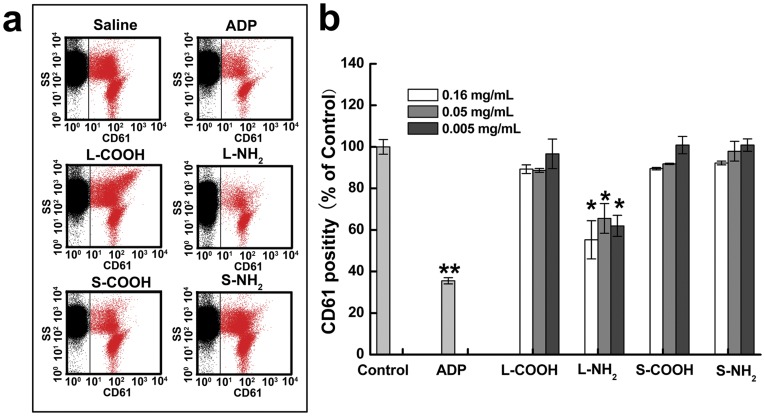
Figure 3. Effects of the MWCNTs on the platelets viability.
(a) Flow cytometric analysis plots of the anticoagulant blood exposed with the MWCNTs at 0.16 mg/ml. The red dots represent viable platelets that express CD61. (b) Percentage of the CD61+ platelets in the blood. *: significantly different from the negative control (*p<0.05, **p<0.01). Values represent mean ± SD.

