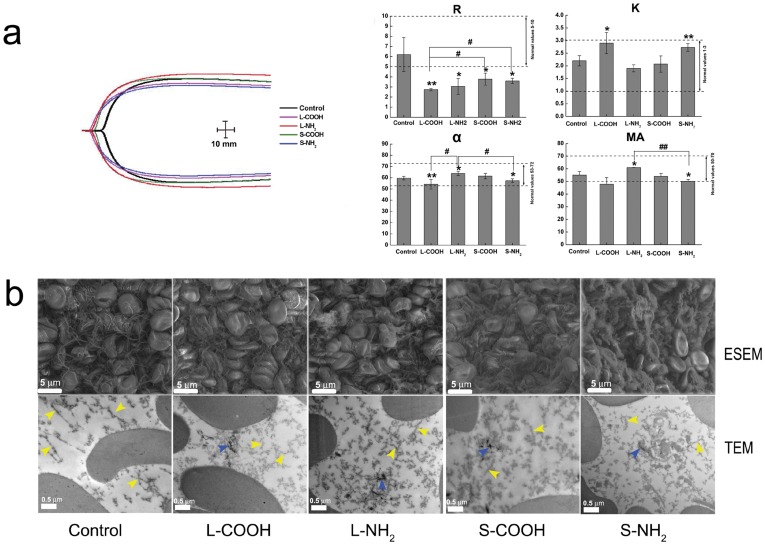
Figure 5. Comparison of coagulation kinetics of the blood after exposure to the MWCNTs.
(a) representative thromboelastography traces for untreated blood (black trace) and blood treated with the MWCNTs; the unit for x- and y- axis is mm. (b) Variations induced by the MWCNTs in the four key coagulation parameters. Dashed lines indicate the normal limits.

