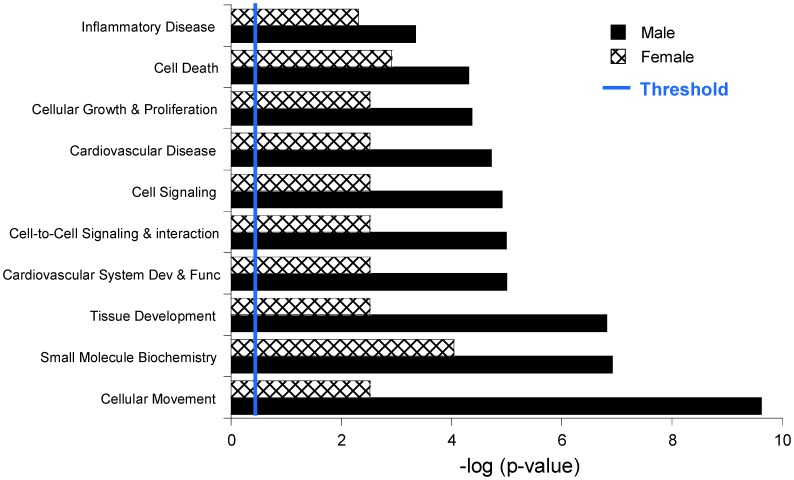
Figure 2. Functional categorization analysis of most significant pathways and diseases represented by microarray data.
A functional categorization analysis of the most significant pathways and diseases represented in the microarray-generated list of significantly different genes was generated using Ingenuity software. The p-value was calculated using the right-tailed Fisher’s exact test. Each bar represents the highest level of function for each category, each of which includes many sub-level functions and is represented by the number of genes in the male and female samples (denoted in parentheses, respectively). The bar was determined by the lowest p-value among sub-level functions for each category. Threshold indicates p-value cutoff of 0.05.

