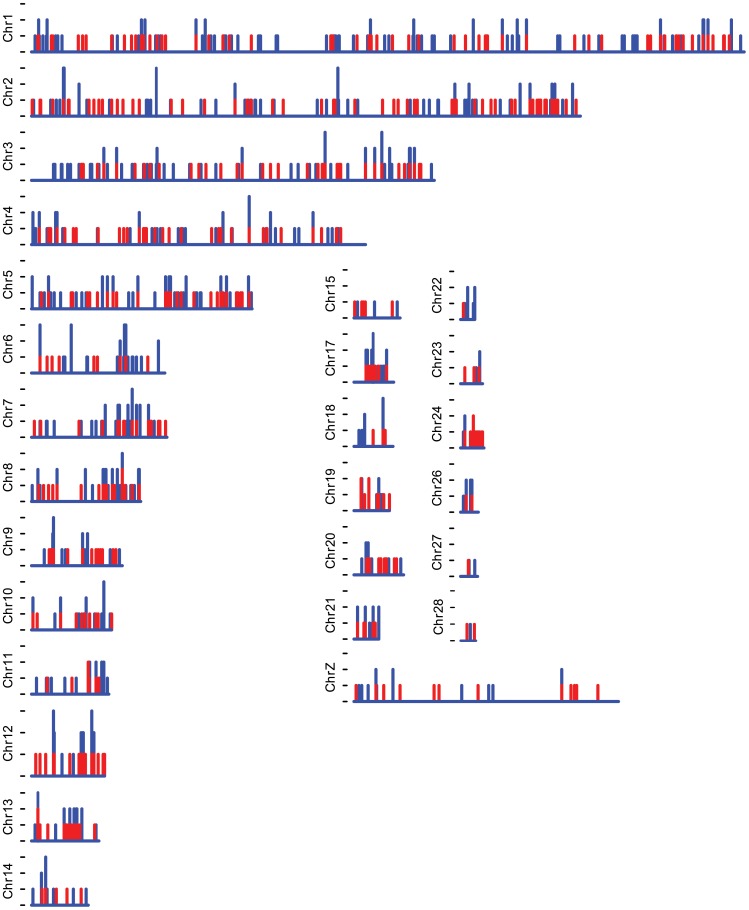
Figure 4. Map of detected and selected SNPs over the chicken genome.
Per chicken chromosome the number of detected SNPs (blue) and selected SNPs (red) per 200 kb bin is shown. Because the bin size is 200 kb, and the minimum distance between selected SNPs is less than 200 kb for the smaller chromosomes, two SNPs per bin occurred in chr 8, chr 11, chr 13, chr 19 and chr24. The y-axis shows the number of SNPs per bin with one per tick.

