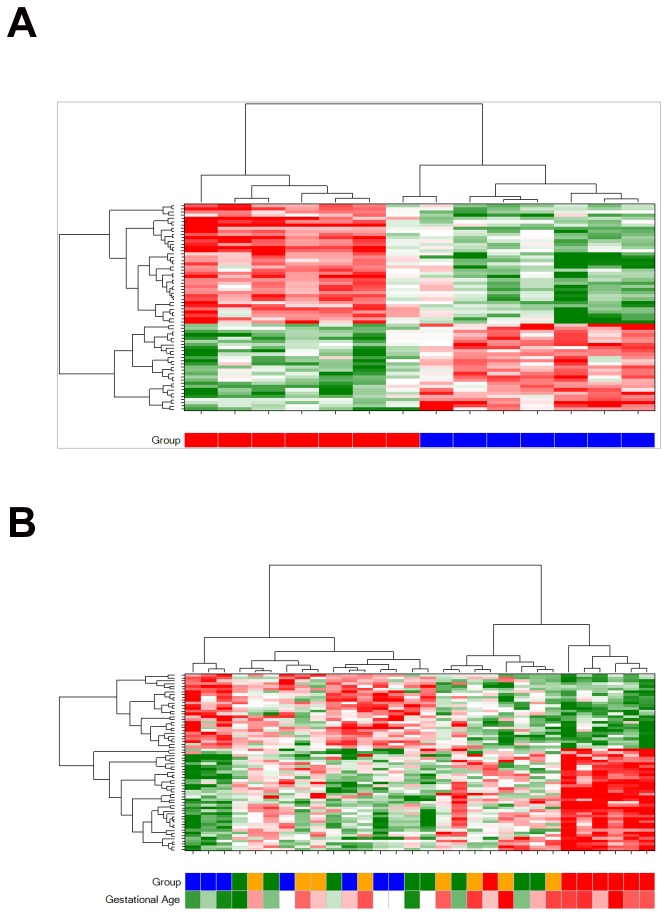
Figure 3. Expression signature for gestational age organises samples into gestational age groups.
Hierarchical clustering of samples (columns) by the expression levels of the 64 probes (rows) significantly associated with gestational age (adjusted p-value<0.05), organises normal birth weight samples perfectly by gestational age group (A) and organises all samples into two clusters with significantly different gestational ages (B). Z-score normalised logged expression levels are denoted in the heat map (green for low, red for high, white for intermediate). X-axis colour bars denote sample classification: high birth weight group (>3700 g) in orange; low birthweight group (<2500 g) in green; normal birthweight and gestational age less than or equal to 37 weeks in blue; or normal birthweight and gestational age more than 37 weeks in red. Gestational age is also represented as a continuous variable in the x-axis colour bar in (B) green for low, red for high, white for intermediate.

