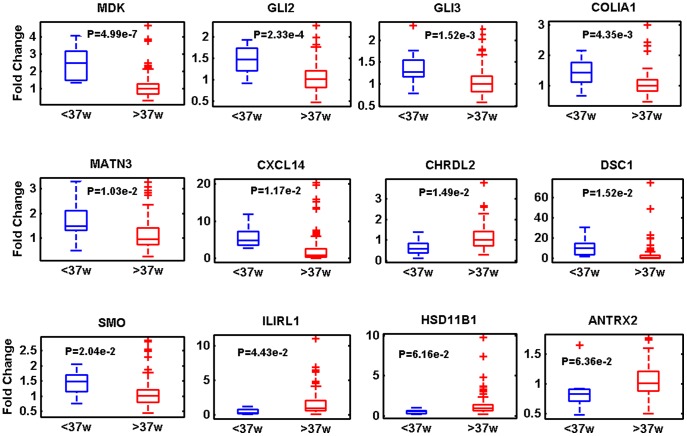
Figure 4. Twelve transcripts have differential expression levels in gestational age groups across the 120 sample replication set.
Fold change with regard to the median sample of the more than 37 weeks gestation group, is shown on the y-axis. Gene names are shown above each panel. P-values from the 2 group tests are shown within each panel. Data is represented as a box plot where the 2–3 quartile range is within the box, the median is denoted by a horizontal line within the box, the min and max are denoted by horizontal lines outside of the box and single outliers are represented by crosses.

