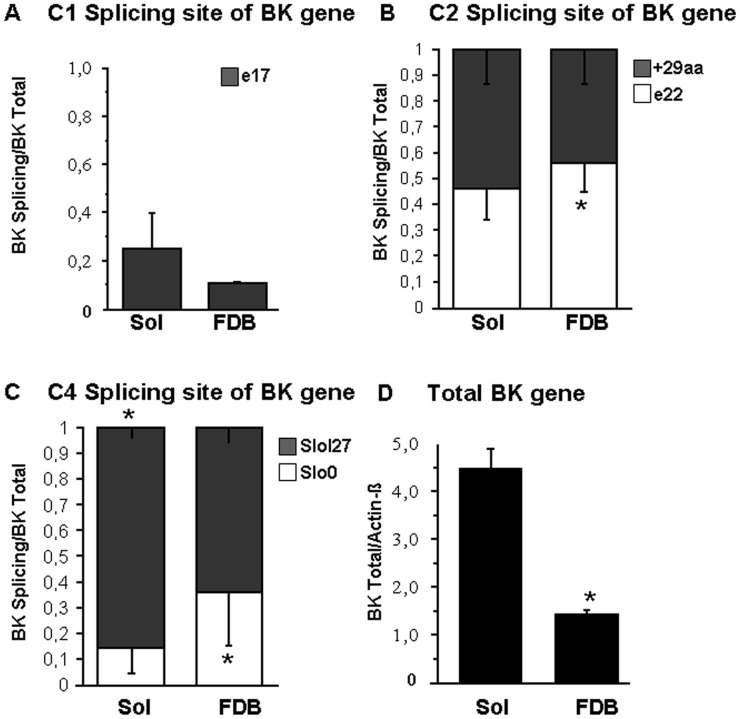
Figure 2. Differential tissue distribution of BK channel splice variant mRNA.
mRNA levels of C1 (A), C2 (B) and C4 (C) splice variants in Sol and FDB expressed as a fraction of total BK channel mRNA expression in each tissue. (D) Differential tissue distribution of total BK channels. mRNA expression of total BK channels is normalized to the expression of beta -actin. Significant differences between data are evaluated by the unpaired Student’s t-test at p<0.05.

