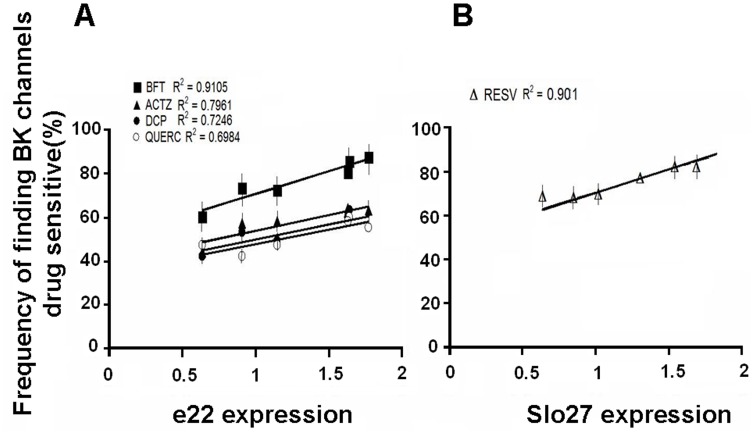
Figure 6. Correlation between the e22 and Slo27 expression levels and drug responses in different muscle phenotypes.
The linear regression analysis between the e22 and Slo27 expression levels and the frequency distribution of patches containing Ca2+activated K+(BK) channels sensitive to bendroflumethiazide (BFT), acetazolamide (ACTZ), dichlorphenamide (DCP), and quercetin (QUERC) in flexor digitorum brevis (FDB) (A) or resveratrol (RESV) in soleus (Sol) (B) fibers for each muscle sample was performed. The e22 and Slo27 expression levels were normalized to the total BK. The correlation coefficient (R2) is reported for each drug.

