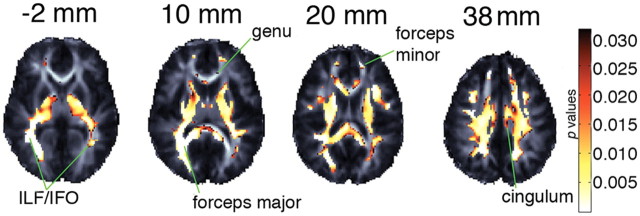
Figure 2.
Drad association with NTRK1-T displayed on a study-specific FA template. Highlighted areas are the p-values indicating voxels in which 31 NTRK1-T carriers have significantly higher Drad than 360 non-carriers after adjusting for age, sex, and kinship (FDR critical p value = 0.031). The statistical test was two-tailed. The left brain hemisphere is displayed on the right. Coordinates listed are for the Z-direction in ICBM space.

