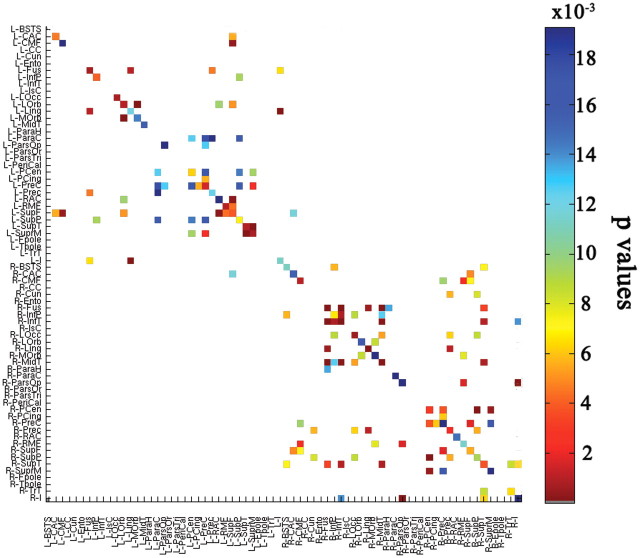
Figure 3.
NTRK1 effect on mean FA for cortical fiber connections, computed using tractography. Colored blocks indicate significant differences between NTRK1-T carriers and non-carriers in mean FA for cortical connections (after FDR correction; critical p = 0.019). Each colored block represents a connection between a cortical region of interest, listed on the x-axis, and another cortical region of interest listed on the y-axis. There are 70 regions in all; connections are not considered if they occur in <95% of subjects. L, Left; R, right; BSTS, banks of the superior temporal sulcus; CAC, caudal anterior cingulate cortex; CMF, caudal middle frontal gyrus; CC, corpus callosum; Cun, cuneus; Ento, entorhinal cortex; Fus, fusiform gyrus; InfP, inferior parietal lobule; InfT, inferior temporal gyrus; IsC, isthmus of the cingulate cortex; LOcc, lateral occipital cortex; LOrb, lateral orbitofrontal cortex; Ling, lingual gyrus; MOrb, medial orbitofrontal cortex; MidT, middle temporal gyrus; ParaH, parahippocampal gyrus; ParaC, paracentral lobule; ParsOp, pars opercularis; ParsOr, pars orbitalis; ParsTri, pars triangularis; PeriCal, pericalcerine cortex; PCen, postcentral gyrus; PCing, poster cingulate cortex; PreC, precentral gyrus; Prec, precuneus; RAC, rostral anterior cingulate cortex; RMF, rostral middle frontal cortex; SupF, superior frontal gyrus; SupP, superior parietal lobule; SupT, superior temporal gyrus; SuprM, supramarginal gyrus; Fpole, frontal pole; Tpole, temporal pole; TrT, transverse temporal gyrus; I, insular cortex.

