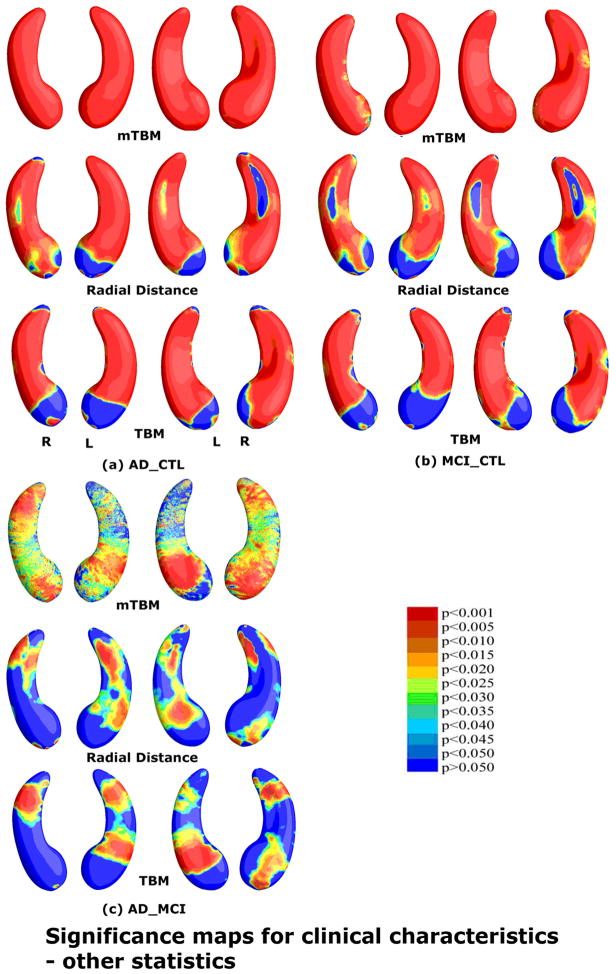
Fig. 7.
Comparison of three other statistics for detecting group differences in the same hippocampal surface dataset as the one in Fig. 3. The three statistics are mTBM (Wang et al., 2010d), radial distance (Thompson et al., 2004a) and TBM (Chung et al., 2008). Non-blue colors show vertices with statistical differences, at the 0.05 level, uncorrected. Critical p values for these maps are shown in Table 1. The statistical results show that new multivariate statistic outperformed the other three statistics except for the AD-MCI comparison where mTBM was the best.

