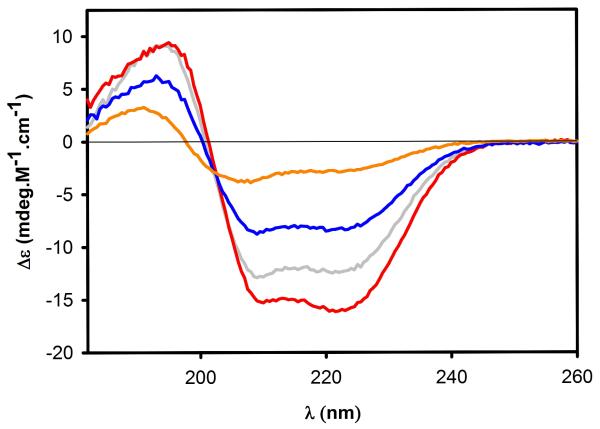
Figure 3.
Far-UV spectra determining the secondary structure of full-length TIP47/perilipin-3 (gray line) and TIP47/perilipin-3 117-434 (red line), 152-434 (blue line), and 187-434 (orange line). Data were acquired over the range 182-260 nm and the plots have been scaled to molar protein concentration.

