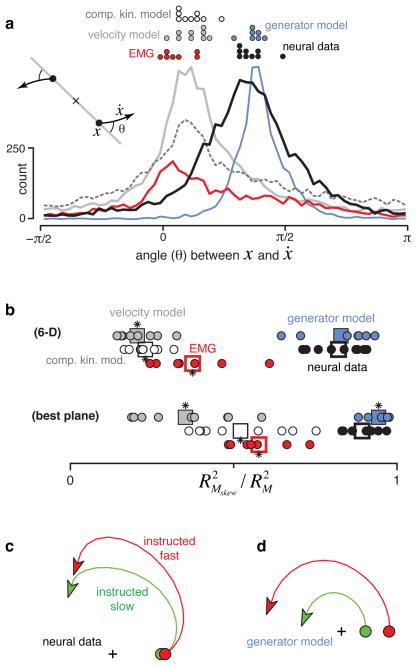
Figure 6.
Consistency of rotational dynamics for real and simulated data. a. Histograms of the angle between the neural state, x, and its derivative, ẋ, for real and simulated data. The angle was measured after projecting the data onto the first jPCA plane as illustrated schematically (inset). Pure rotation results in angles near π/2; pure scaling/expansion results in angles near 0. Distributions include all analyzed times and conditions. Dots at top show distribution peaks for individual datasets. b. Quality of the fit (R2) provided by Mskew relative to an unconstrained M. We assessed fit quality for both the rank 6 matrices that capture dynamics in all 6 analyzed PCs/jPCs (bottom row) and the rank 2 matrices that capture dynamics in the first jPCA plane (top row). Circles plot performance for individual datasets. Squares give overall averages. Asterisks indicate a significant difference (t-test, p<0.05) from neural data. c. Average (across monkeys A and B) neural trajectory for all instructed-slow conditions (green) and all instructed-fast conditions (red). d. Similar to c but for the generator model.

