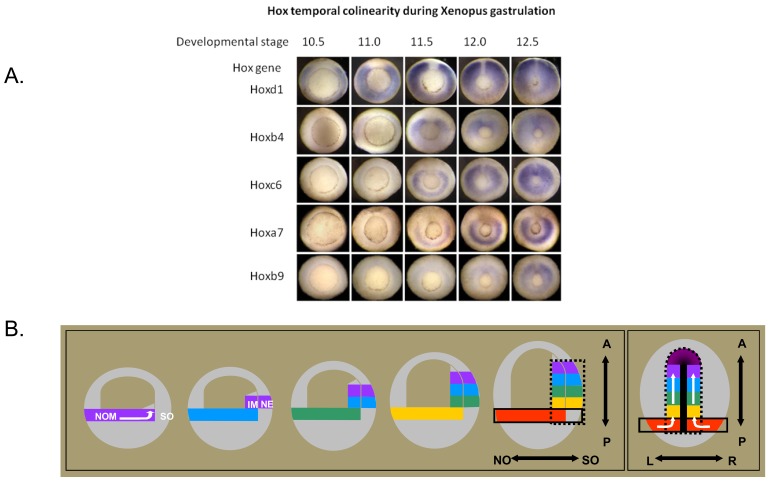
Fig. (4). Temporal Collinearity And Time space translation.
a. Temporal Collinearity In the Xenopus Gastrula.
The figure [from 11] shows Hox expression patterns at sequential stages during gastrulation in Xenopus. The embryos are seen from underneath, where a ring (the blastopore) shows the position where mesoderm tissue invaginates during gastrulation. This ring gets smaller as gastrulation proceeds and the upper tissues in the embryo spread out and cover the lower part of the embryo (epiboly). The expression of several different Hox genes, seen as blue colour by in situ hybridisation, is in each case initially in the gastrula mesoderm in the zone above (outside) the ring. Hox expression is thus seen as a blue ring, and since it is initially only in part of the mesoderm (non organiser nesoderm), the ring is initially broken. This ring of Hox expression gets smaller as the blastopore ring gets smaller and mesoderm involutes into the embryo. The figure shows expression of a sequence of Hox genes with different paralogue numbers, between 1 and 9. It will be seen that the Hox gene with the lowest paralogue number starts expression first and later numbers start sequentially later. It will also be seen that the Hox genes in this time sequence include members of all of the 4 primary vertebrate paralogue groups (a,b,c,d).
b. Time-space translation.
Timed interactions between the Hox expressing non-organiser mesoderm and the Spemann organiser generate positional information during Xenopus gastrulation. The drawings [from 11] show simplified 2-dimensional representations of Xenopus gastrulae. The first 5 drawings show parasagittal (ventral to dorsal) two dimensional representations of gastrula profiles, starting at the beginning of gastrulation and then at sequential stages till the end. The last (6th.) drawing shows the end of gastrulation, from the dorsal side (profile at the level of the dorsal axial mesoderm). Hox expressing tissue (NOM (NO and I) and, late in gastrulation neurectoderm (N)) is represented by different colours, each of which represents a different hox code. Initially, the coloured bar represents the broken ring of NOM in the wall of the embryo. The later internal coloured blocks at the dorsal side of the embryo represent the involuted NOM mesoderm. The coloured blocks next to them in the wall of the embryo represent the overlying neurectoderm, which also comes to express hox genes. Hox expression codes are copied from the gastrula mesoderm to the neurectoderm. The SO is shown only in the last drawing, as the heavy median black line. By this stage, it has become the notochord and a head mesodermal portion. The first 5 drawings represent paraxial profiles, where the organiser is not available. The black dotted line in the last drawing depicts the sphere of influence of the SO. N: neurectoderm, NO: non-organiser mesoderm; S,: Spemann organiser; A: Anterior; P: Posterior; L: Left; R: Right. N nonorganiser; S Spemann organiser. The white arrows reflect directions of cell movement flow. To dorsal, anterior and internal(drawings 1 and 6). -There is a collinear time sequence of hox expression in non involuted non-organiser mesoderm (NOM) in the gastrula (depicted by the spectral sequence of colours). -During gastrulation involution movements continuously bring populations of cells from the NOM into the inside of the embryo, where their current Hox code is transiently stabilised. See stack of blocks of different colours, reflecting a history of the collinear hox mesodermal time sequence, in the internal involuted mesoderm. -Stable (ectodermal) Hox expression is induced by a combination of signals from the SO and the Hox expressing NOM. See corresponding blocks of sequential spectral colours in the gastrula's mesoderm and outer layer, reflecting a vertical transfer of the Hox codes from involuted mesoderm to overlying neurectoderm. A “Hox stripe” as part of the anterior–posterior Hox pattern is thus formed at the dorsal side [11, 14].

