
Figure 1.
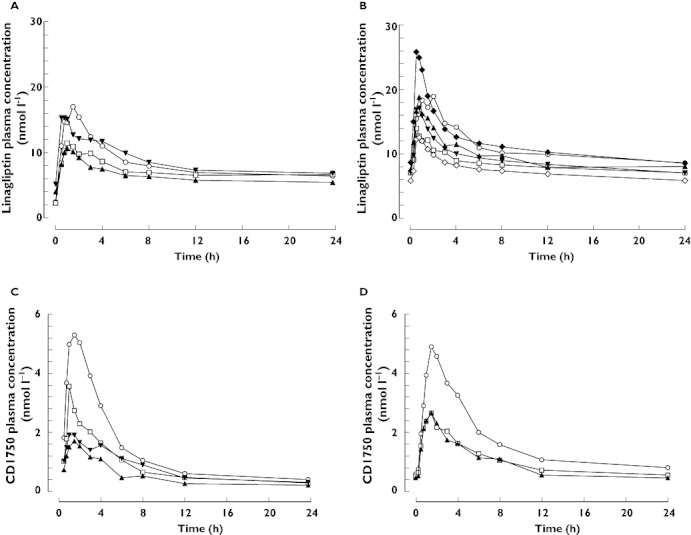
Arithmetic mean plasma concentration–time profiles of linagliptin 5 mg after single oral doses (A) and at steady-state (B), and of CD1790 after single oral doses of linagliptin (C) and at steady-state (D) in healthy subjects (normal hepatic function) and patients with mild, moderate or severe hepatic impairment. (A and C) Normal hepatic function (n = 8) ( ); Mild hepatic impairment (n = 8) (
 ); Moderate hepatic impairment (n = 9) (
 ); Severe hepatic impairment (n = 8) (
 ); (B and D) Normal hepatic function (n = 8) (
 ); Mild hepatic impairment (n = 8) (
 ); Moderate hepatic impairment (n = 8*) (
 ); Severe hepatic impairment (median prediction†) (
 ); Severe hepatic impairment (5th percentile prediction†) (
 ); Severe hepatic impairment (95th percentile prediction†) (
 ). *Eight patients only completed the multiple dosing period in the moderate impairment group. †Distribution of predicted arithmetic mean steady-state profiles for severe hepatic impairment group (1000 simulated studies with n = 8)