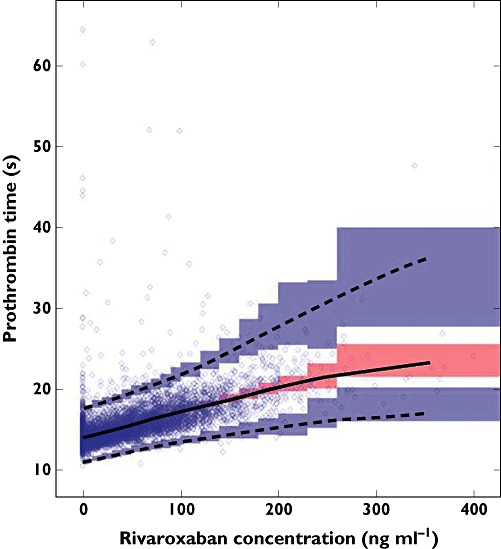
Figure 3.

Visual predictive check plot for the pharmacokinetic–pharmacodynamic (PK–PD) model. Concinuous black line is the median prediction for rivaroxaban concentrations. The upper and lower dashed black lines represent the fifth and 95th percentiles of predicted data, respectively. The semi-transparent red-shaded area represents the simulation-based 90% confidence intervals for the median predicted data, while the semi-transparent blue-shaded areas represent the simulation-based 90% confidence intervals for the fifth and 95th percentiles of the predicted data. The semi-transparent blue circles represent the observed concentrations
